
Choosing where we source the food that we eat makes a difference to the environment, but by how much? After churning through around 100 petabytes of data, beginning with our LIFE metric and moving onto food provenance maps and import/export data for the world, we now know the answer can vary by three orders of magnitude for species extinction risks.
Our paper in Nature Food came out today with all the tasty details and implications for food policies worldwide. In order to make the data easier to explore, I knocked up an interactive global explorer using the data that the team (lead by Thomas Ball) generated.

The methodology is described in the paper:
The marginal impact of current food consumption on biodiversity can be viewed as the forgone opportunity to restore biodiversity arising through ongoing agricultural land use. By linking LIFE with spatial crop and pasture distributions, consumption, production and trade data from the Food and Agriculture Organisation of the United Nations, [...] we quantify the > opportunity cost to biodiversity of producing or consuming 1kg of each FAO-aligned food commodity in 174 countries, taking the feed and grazing requirements for animal products into account. -- Food impacts on species extinction risks can vary by three orders of magnitude
The results themselves are absolutely fascinating. Firstly, ruminant meat has median consequences 100 times higher than that of legumes and pulses, even when accounting for the high protein content. That burger, while delicious, has an enormous biodiversity cost somewhere in the world! Bear in mind that more than 3/4 of human-appropriated land surface on the planet is dedicated to the production of animal products while providing only 17% of global calories.
But if you really want a burger, then choosing where you source the meat from makes a huge difference as well. There is a great deal of spatial variance about the selection of each commodity.
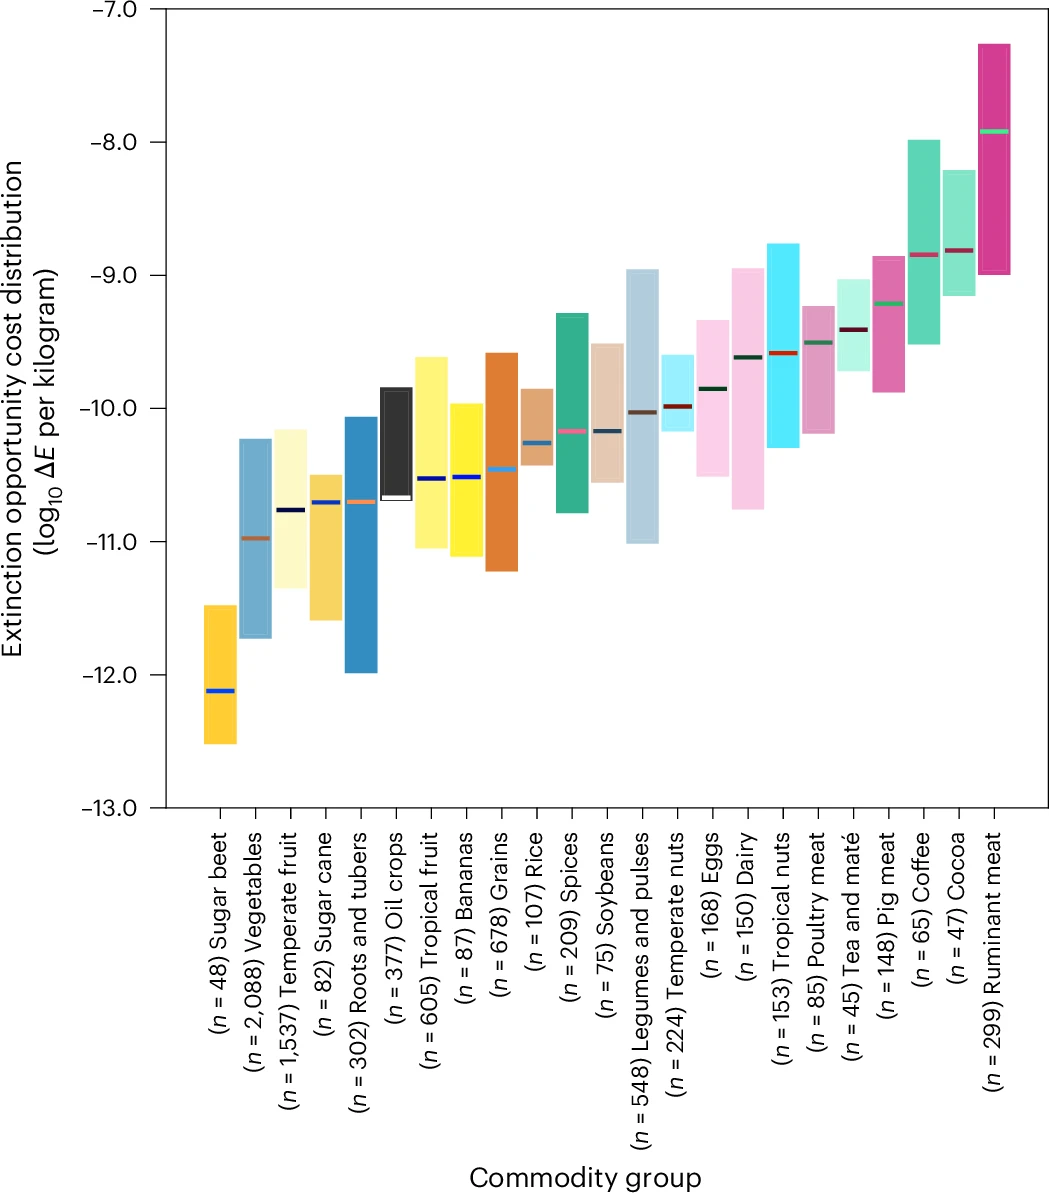
The vertical length show the spatial variance. It gets more interesting when you break it down by country and examine the imports and exports of each one:
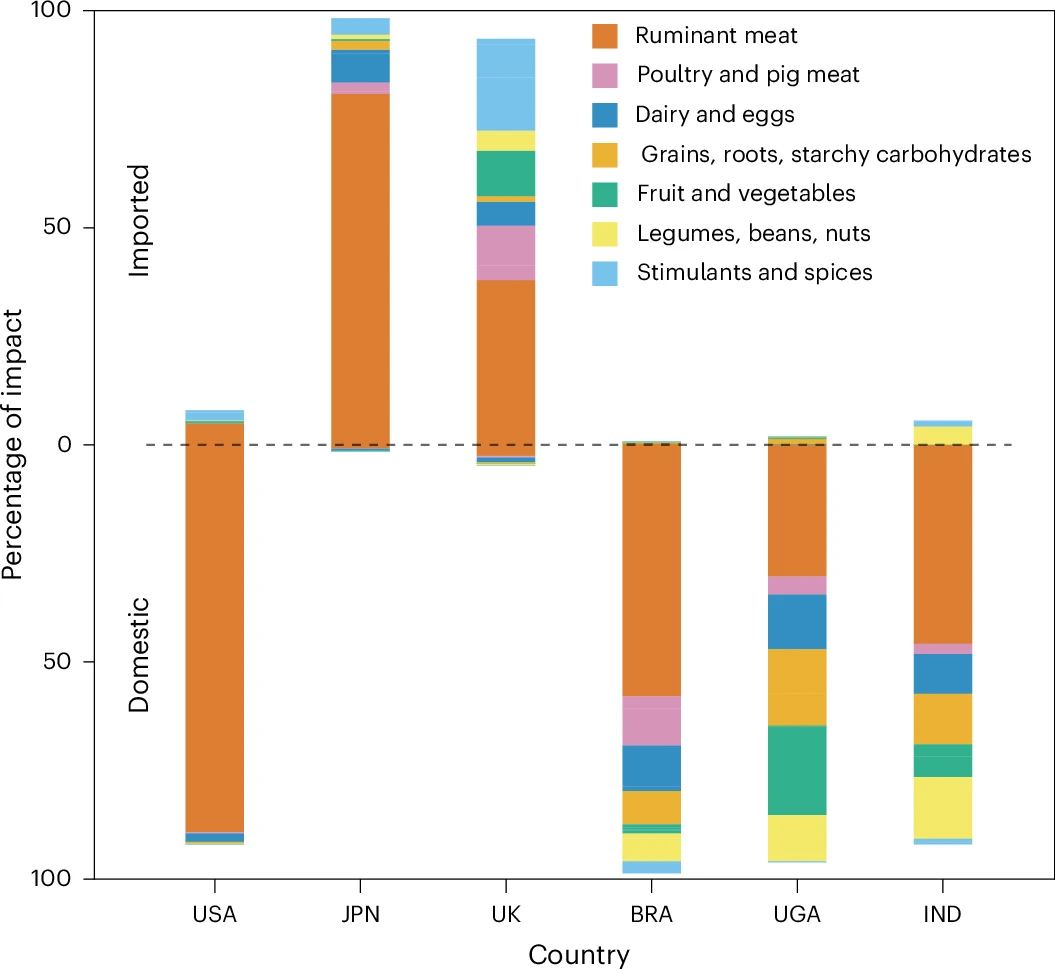
The biodiversity leak becomes clear now! Some countries do consume enormous amounts of meat, but do so from domestic production (i.e. a local political decision). Others, like the UK or Japan, import vast amounts of damaging food from other countries which are highly biodiverse, resulting in the demand that is one of the primary drivers of deforestation.
The data is out there now, under a CC-BY-SA license, and the interactive FOOD explorer allows you to break down impacts per country and look through 150 different foodstuffs.
I also mentioned the vast amount of data processing involved in coming up with these numbers; Michael Dales has uploaded the calculators over to our quantifyearth/ code organisation, and will be presenting the magic library Yirgacheffe that drives much of this processing at PROPL25 in October. Tune in if you'd like to hear more about the computer science side of this sort of analysis!
Read more about Food impacts on species extinction risks can vary by three orders of magnitude.