COMPASS 2024 report on the CoRE stack RIC meeting / Jul 2024 / DOI
This is a trip report of ACM COMPASS 2024 held in New Delhi, which had a novel track of "Research to Impact Collaboratives" that drew me in. The general chair, Aadi Seth wrote a fantastic book on "Technology and Disempowerment" a few years ago, and he organised one RIC session on the CoRE Stack -- a climate adaptation stack for rural communities. This was a must-visit for me as it is closely related to the work we've been doing on
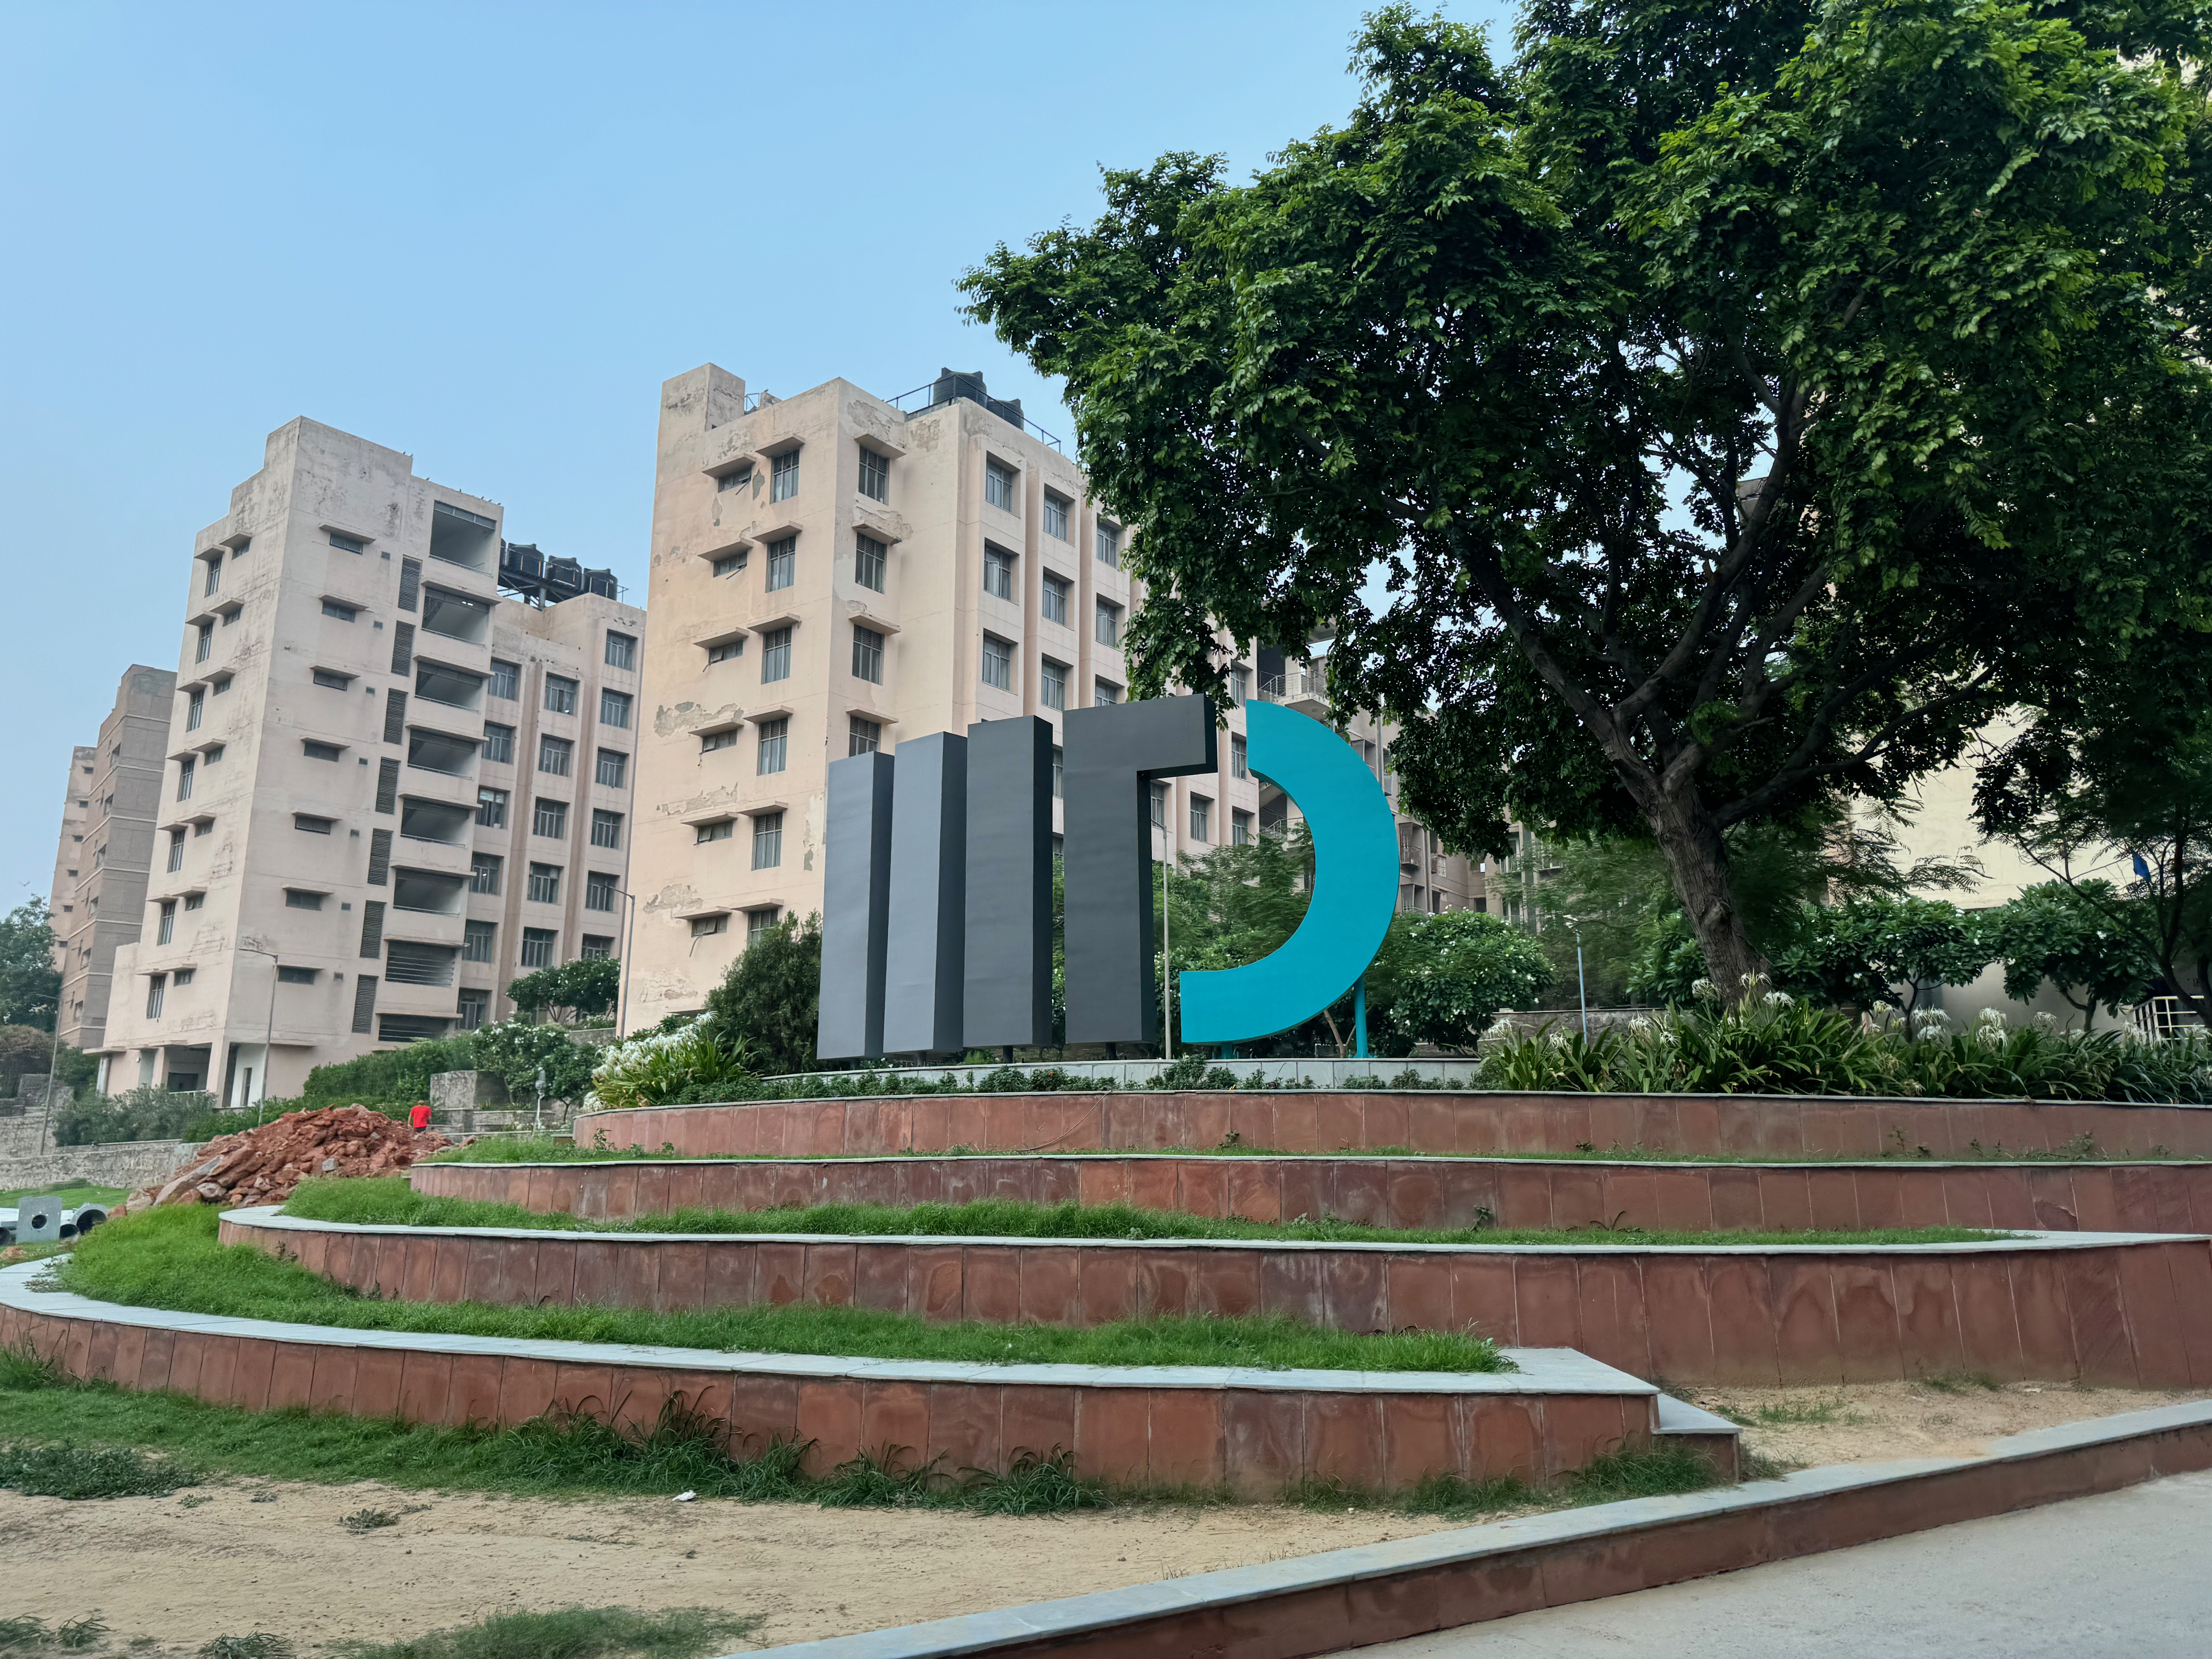
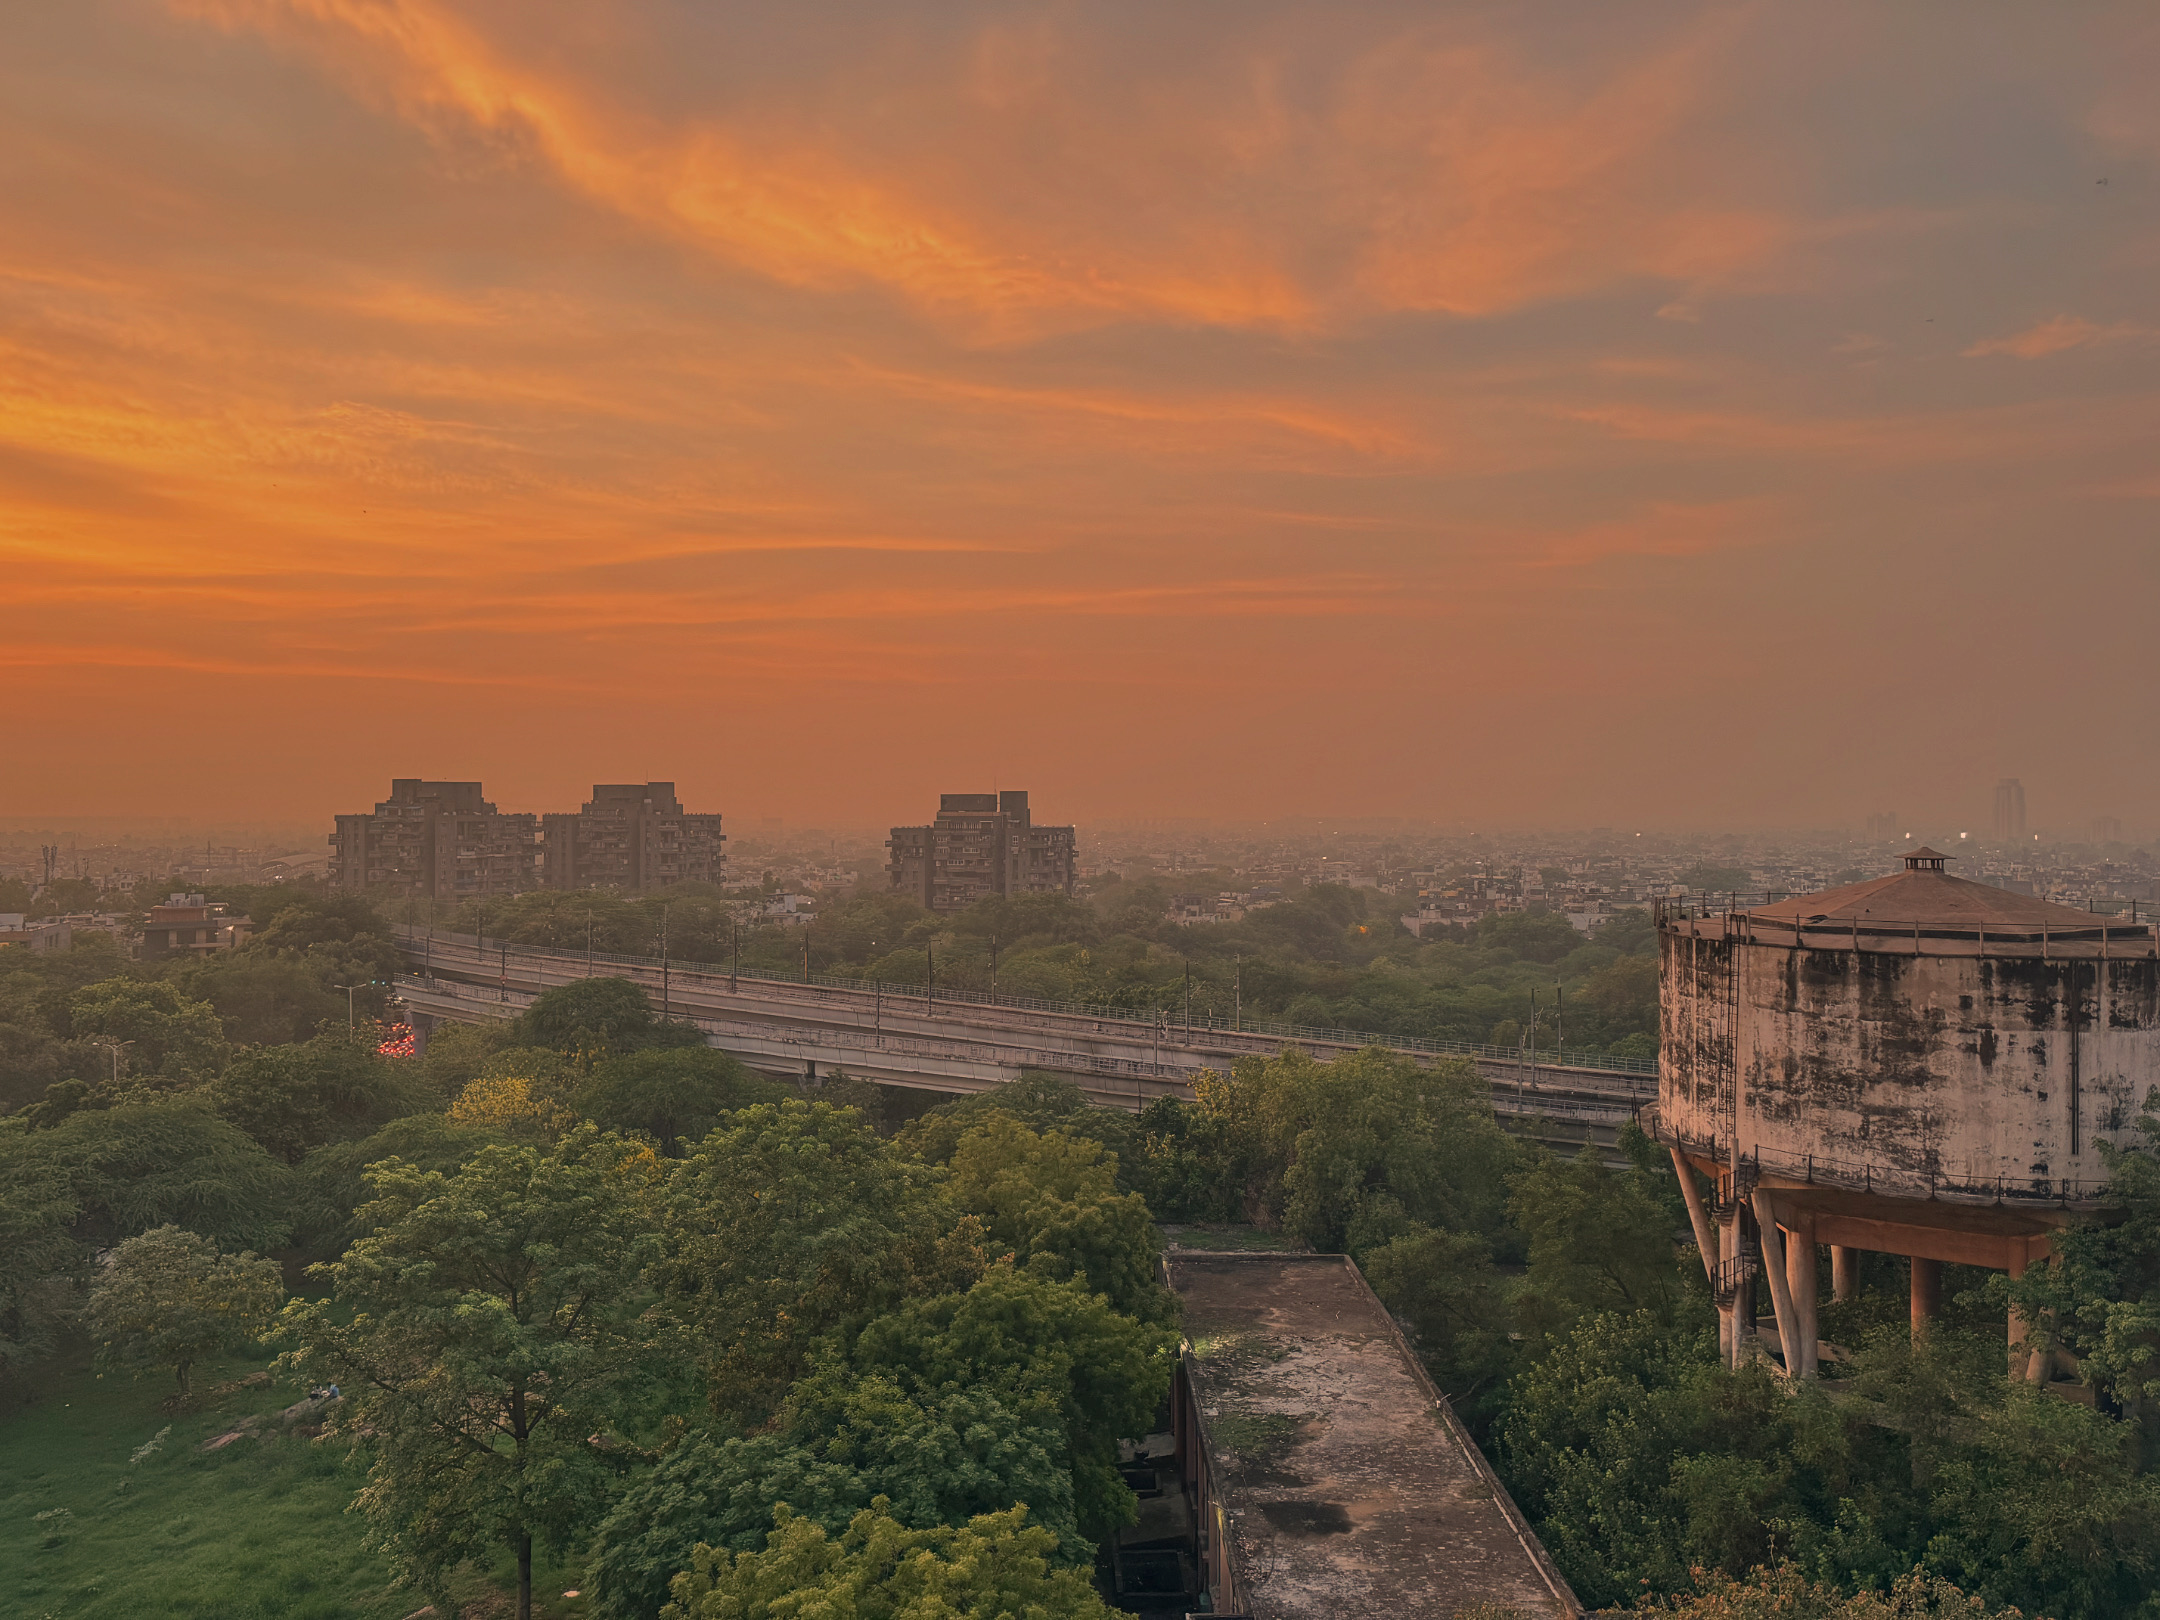
The conference itself was held at IIIT-D in New Delhi, right at the cusp of the monsoon season and after record-breaking temperatures. Luckily, as always, the hospitality and welcoming nature of New Delhi overrode all the climate discomfort!
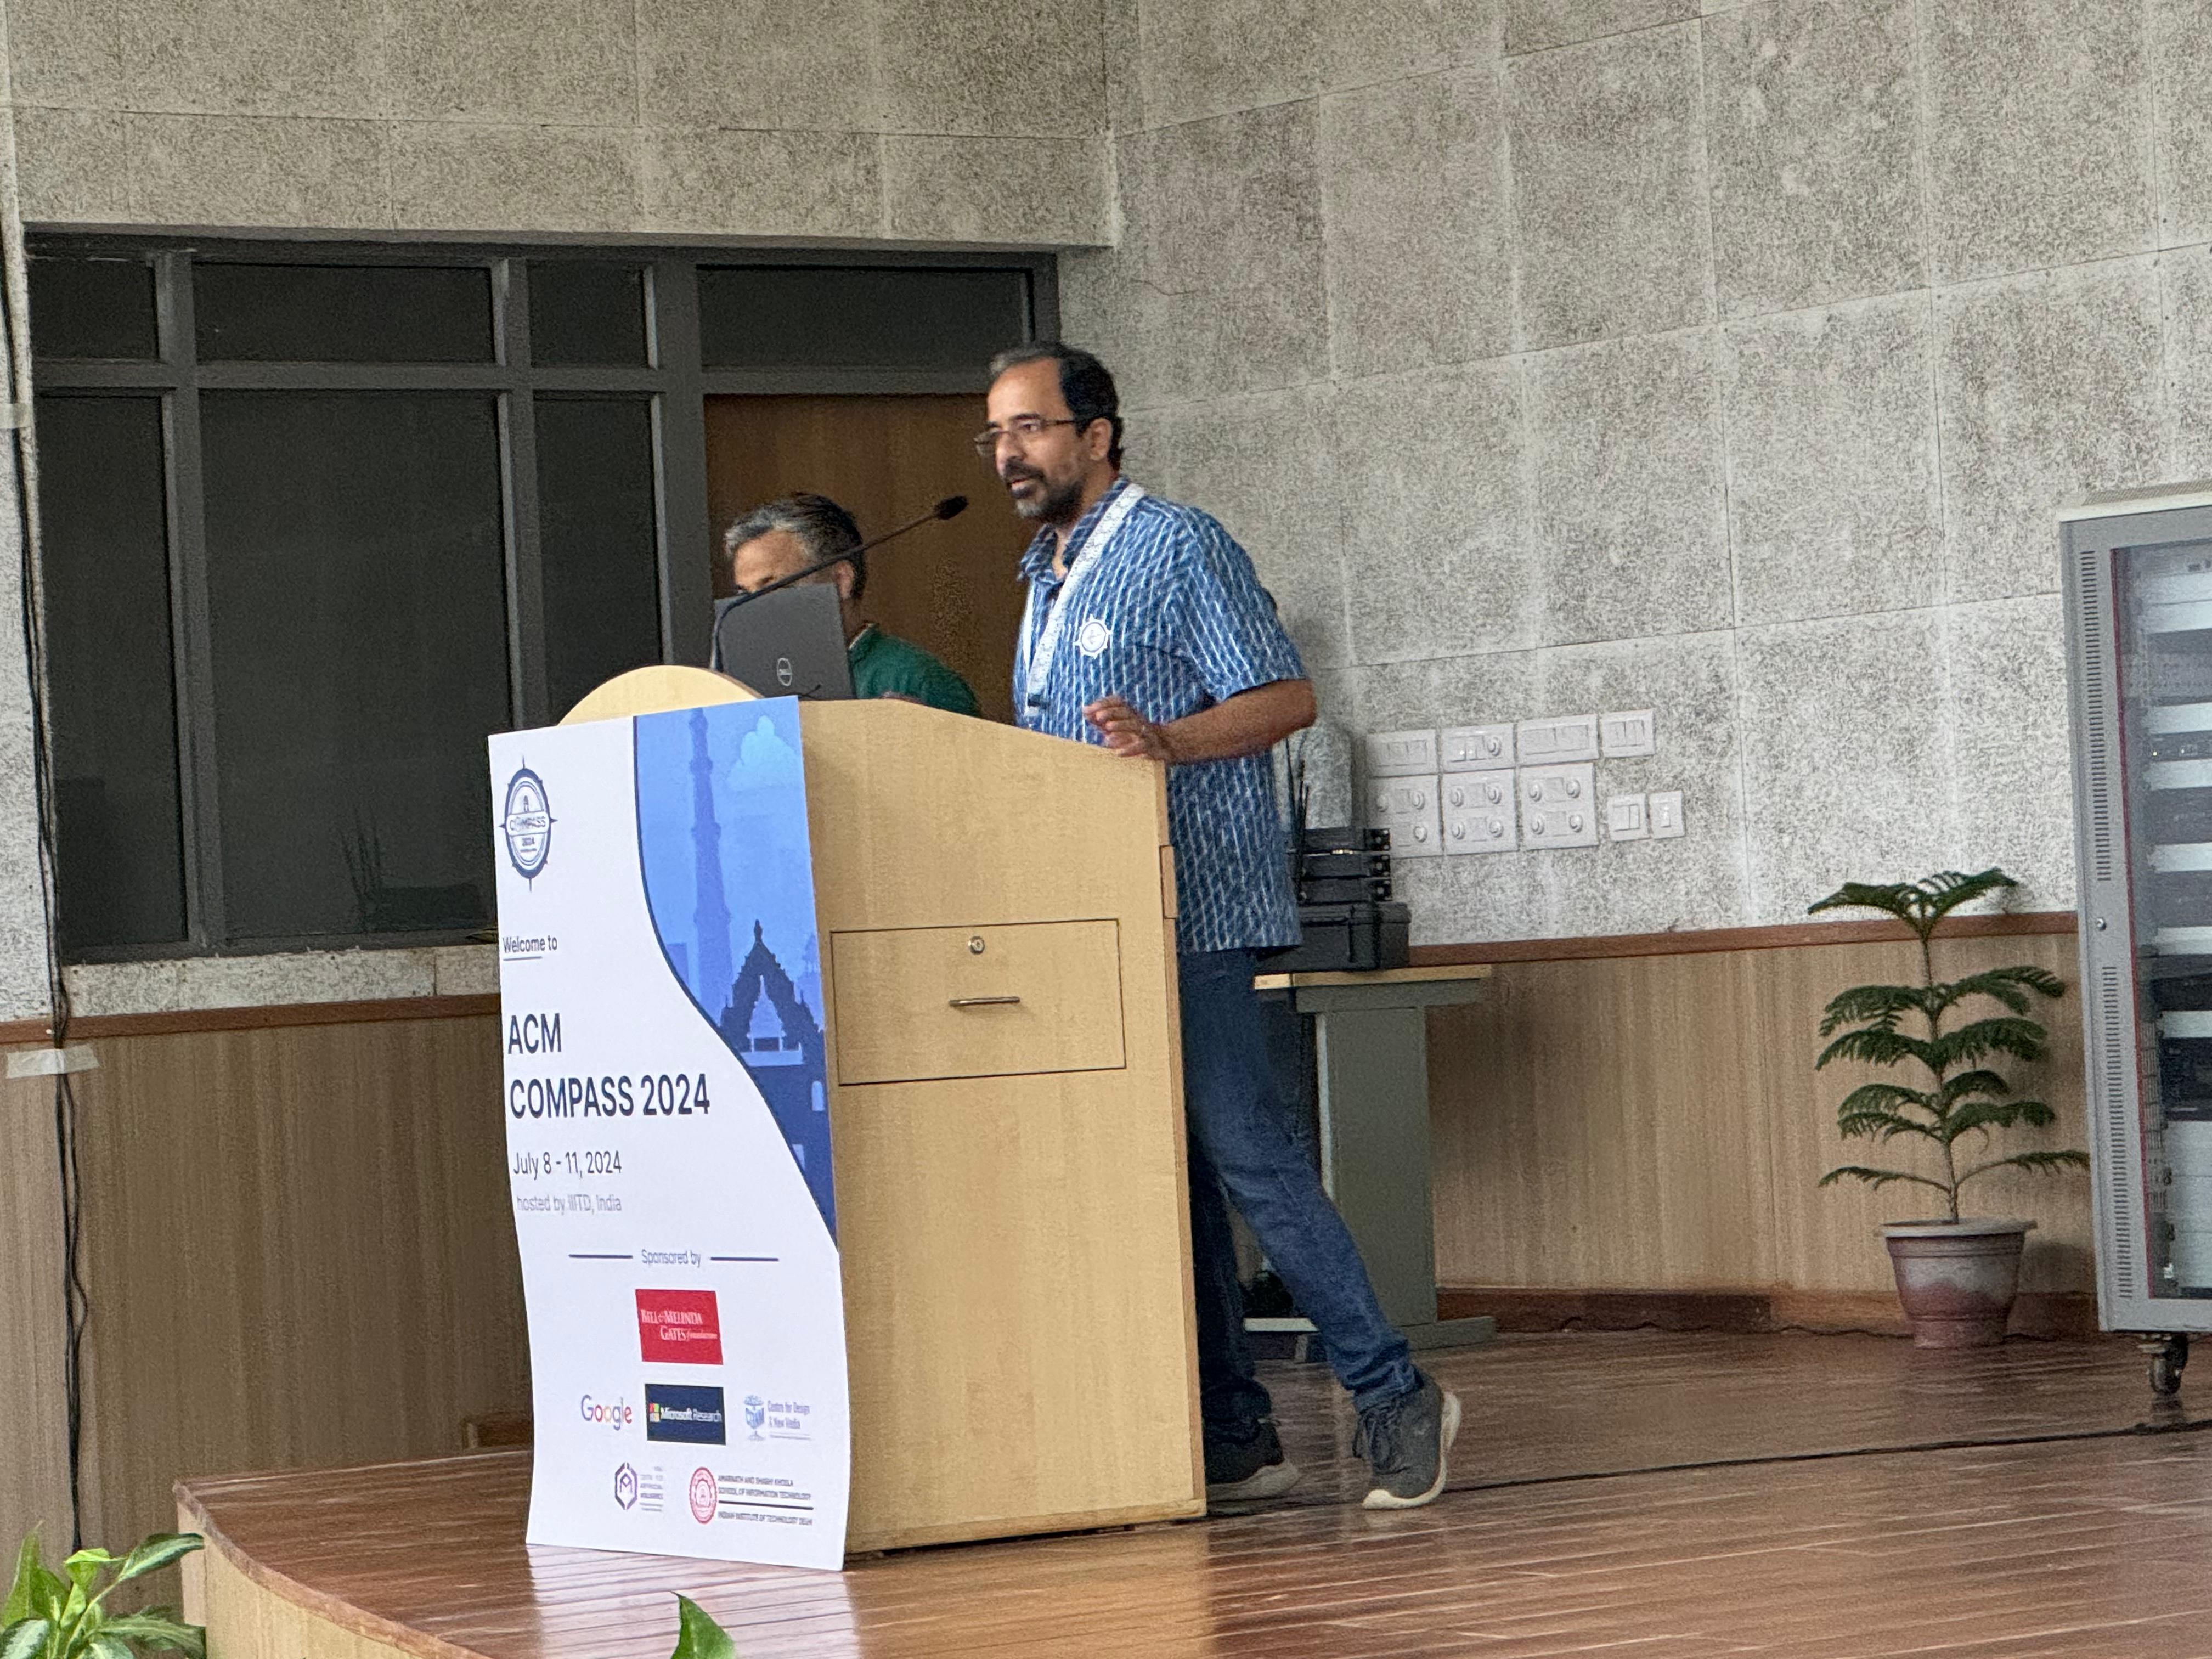
The main focus of this report is the one-day RIC held on the 8th July 2024. The RIC had around 60 attendees in person and 40 online, and was a mix of presentations and discussions on the CoRE stack and how it could be used to address climate adaptation in rural communities. The day was divided into two sessions, with the first being a series of scene setting presentations by practitioners and researchers, and the second being a series of breakout discussions on how the CoRE stack could be used in different contexts.
Intro: The RIC Core stack (Aadi Seth)
Data driven approaches enable new approaches to social ecological system health, but need to be grounded in community based approaches, and the scope is too vast for any one group to handle. The CoRE stack (Commoning for Resilience and Equality) is being architected as a digital public infrastructure consisting of datasets, pre-computed analytics, and tools that can be used by rural communities and other stakeholders to improve the sustainability and resilience of their local landscapes. It will enable innovators to build upon and contribute their own datasets, use APIs for third-party apps, and track and monitor socio-ecological sustainability through a systems approach. The CoRE stack broadly consists of four layers.
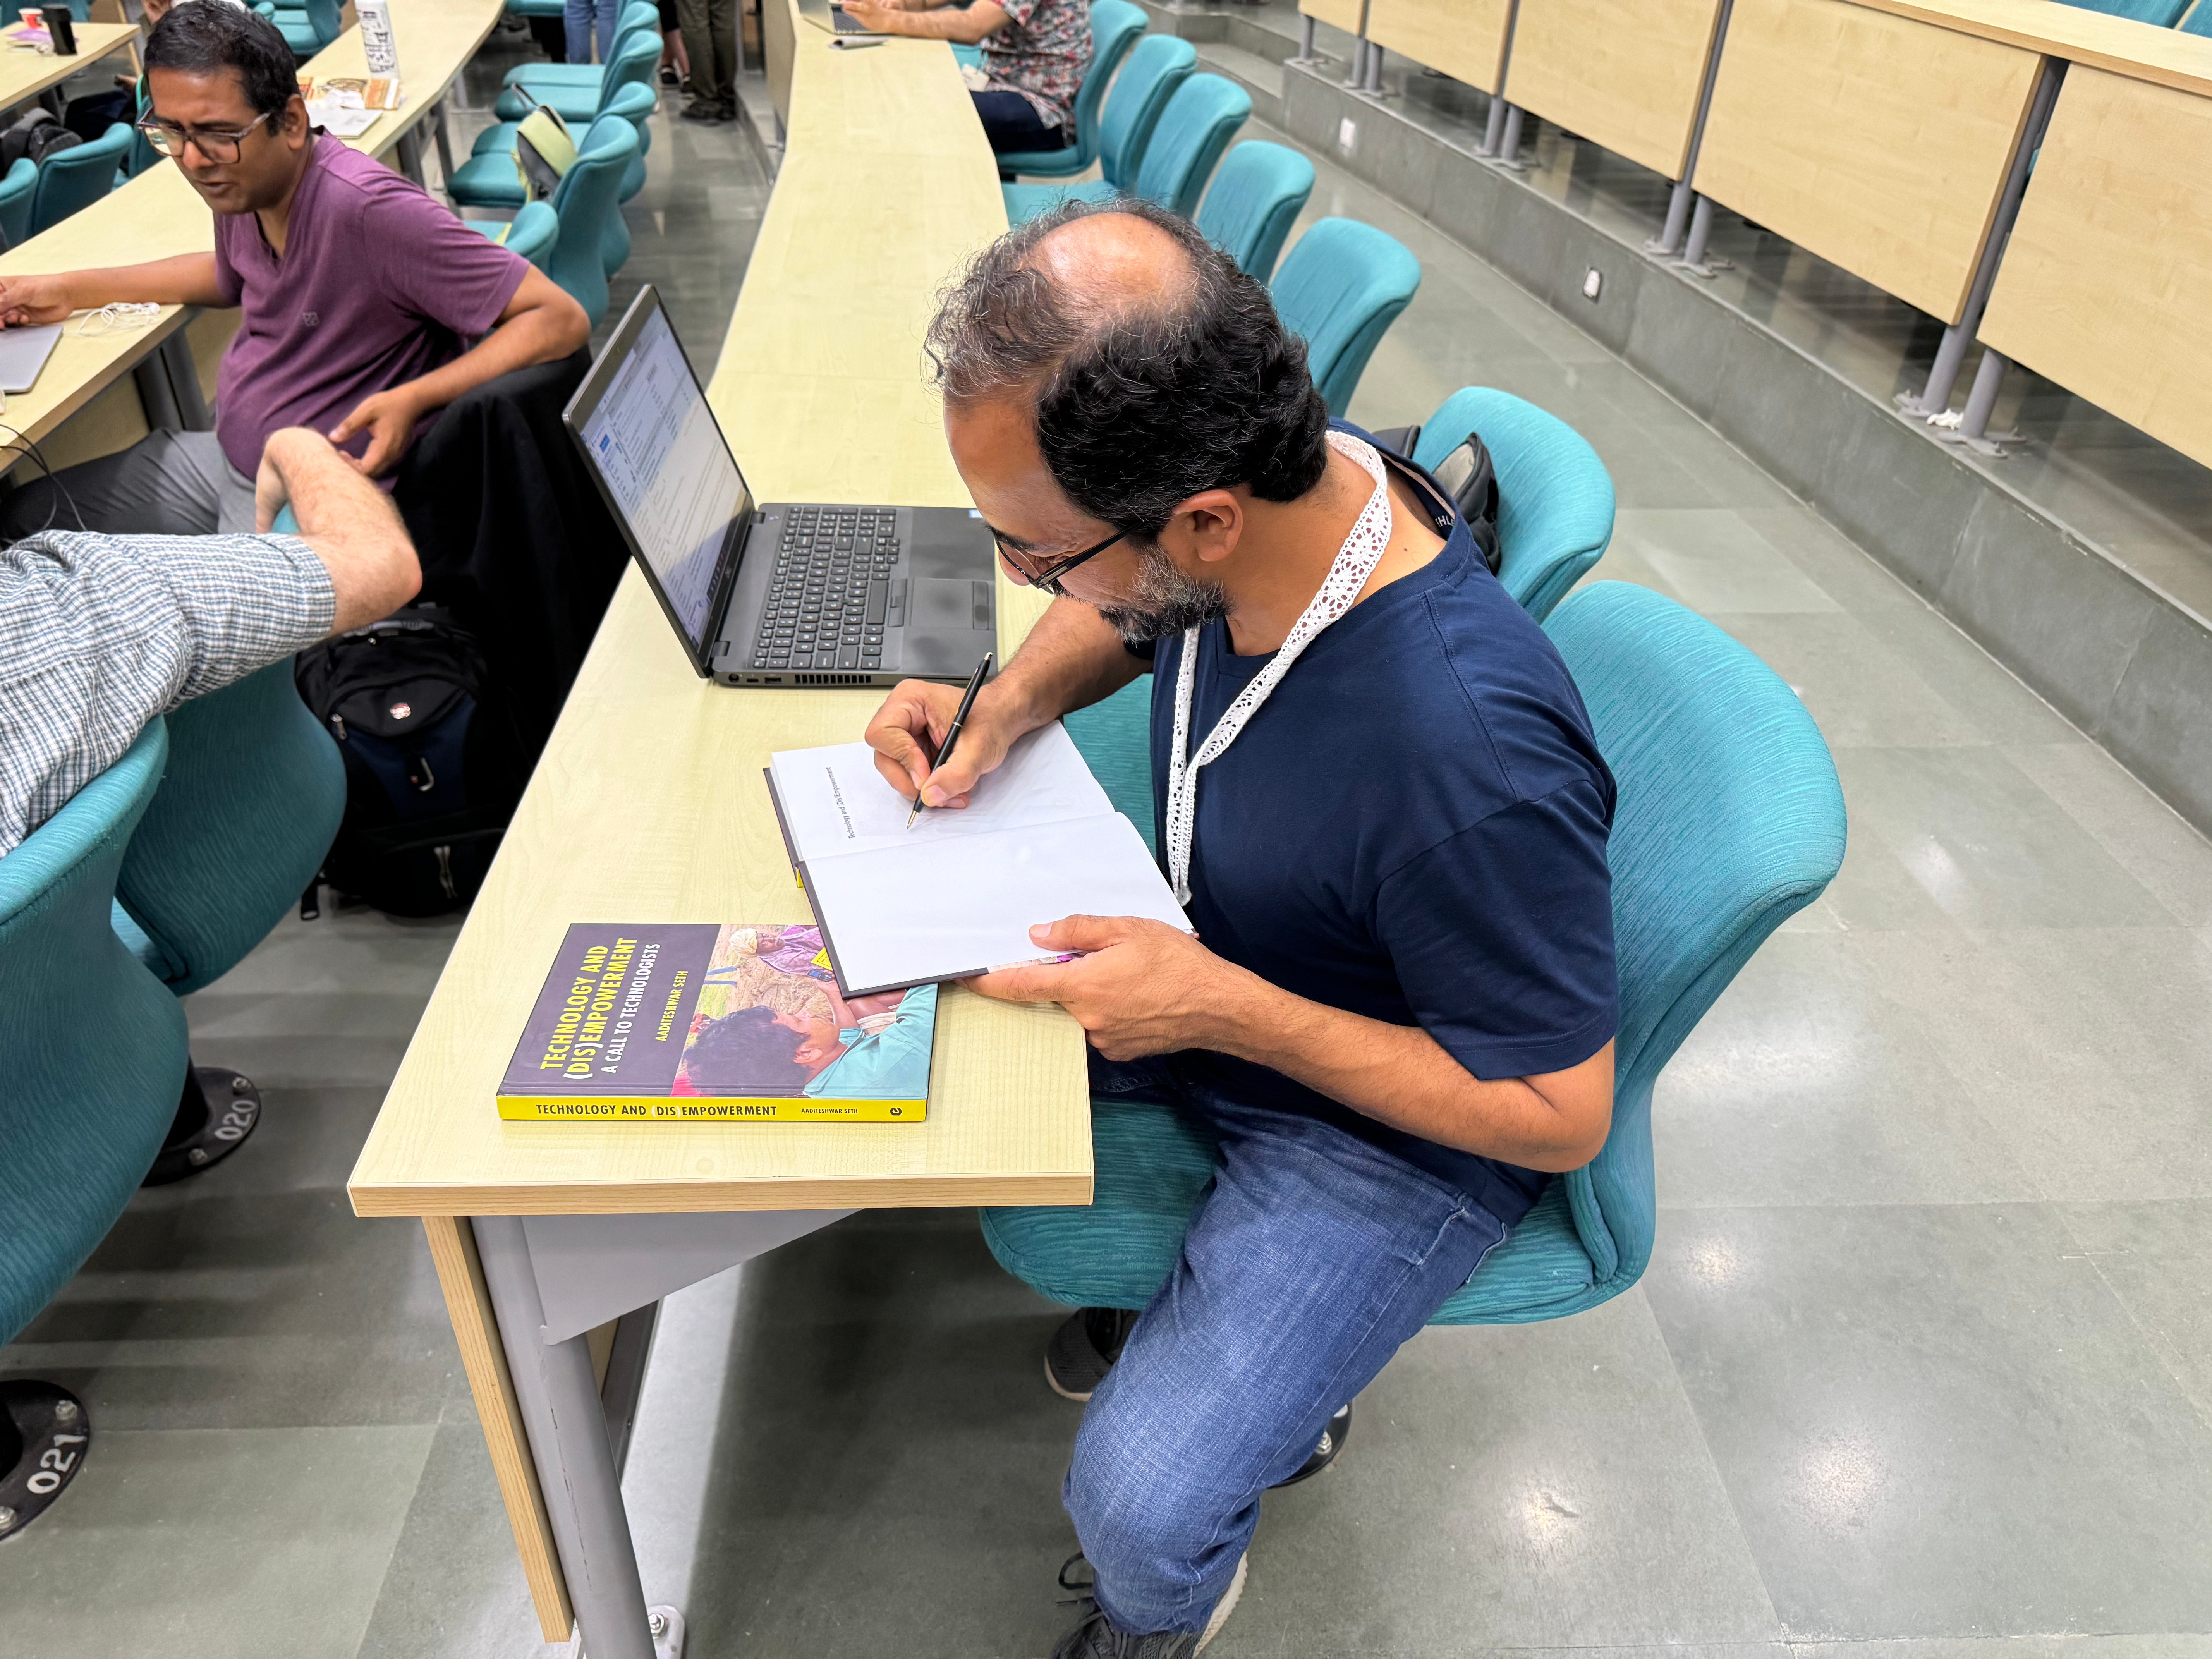
The broad approach is bottom-up usecase discovery, and picking a digital public infrastructure approach to work with civic services with, and to do distributed problem solving across stakeholders in academia, government and business. Aadi noted the need to balance between standards and design and end-to-end servicing, and the overheads of collaboration across so many people; see the notes on RIC collaboration across people.
Aadi then described the CoRE stack is a logical layered architecture:
- Layer 1 is the inclusion of new datasets: what is the standards and processes behind this? There are a lot of geospatial data products around, including community data that has been gathered in an ad-hoc way.
- Layer 2 is the generation of indicators, APIs and reports which give us landscape level socio-ecological indicators. Includes alert services, computation infrastructure and suport.
- Layer 3 are the tools and platforms for implementation partners and communities. There are planning tools that are community based and participatory processes. Once we "know our landscape" we can perform fund allocation guidelines. Example of such as tool is Jaltol, for landscape and site-level analysis. And ultimately we want to support new innovations such as dMRV for credits or socioecological indices.
- Layer 4 is about integrating into government and mark programmed, such as water security, foresty and biodiversity credits, natural farming, flood hazard adaption and so on.
To enable this, Aadi motivated the need to work together with networked co-creation and a digital commons and build on top of it with open licenses. We need to overcome fault lines not only in terms of new climate change problems but also socio-ecological barriers. And ultimately we need to go to scale and work with government departments to make urgent improvements.
An example of this is water security, via WellLabs Jaltol which allows for landscape characterisation for action pathways and side validation decision support tools, but also builds community based capacity for social accountability. E.g. given a drainage network, if you were to construct a new water body at this point, what would the effect be on downstream water bodies and the communities that depend on it?
Aadi states the goals for this RIC:
- Find new usecases, what challenges exist, and what principles we adopt for collaboration.
- Look at problems through different lenses: issues of equity, data validity, unnecessary digital labour, aligned with knowledge commons, scaling challenges, productisation challenges.
- Consider the data and algorithm standards necessary to enable networked co-creation but not hinder progress
- Think in productised terms for end-to-end usecases to solve real problems in rural communities.
Discussion Session 1
Sustainability Action at Scale. Abhijeet Parmar (ISB)
Slides
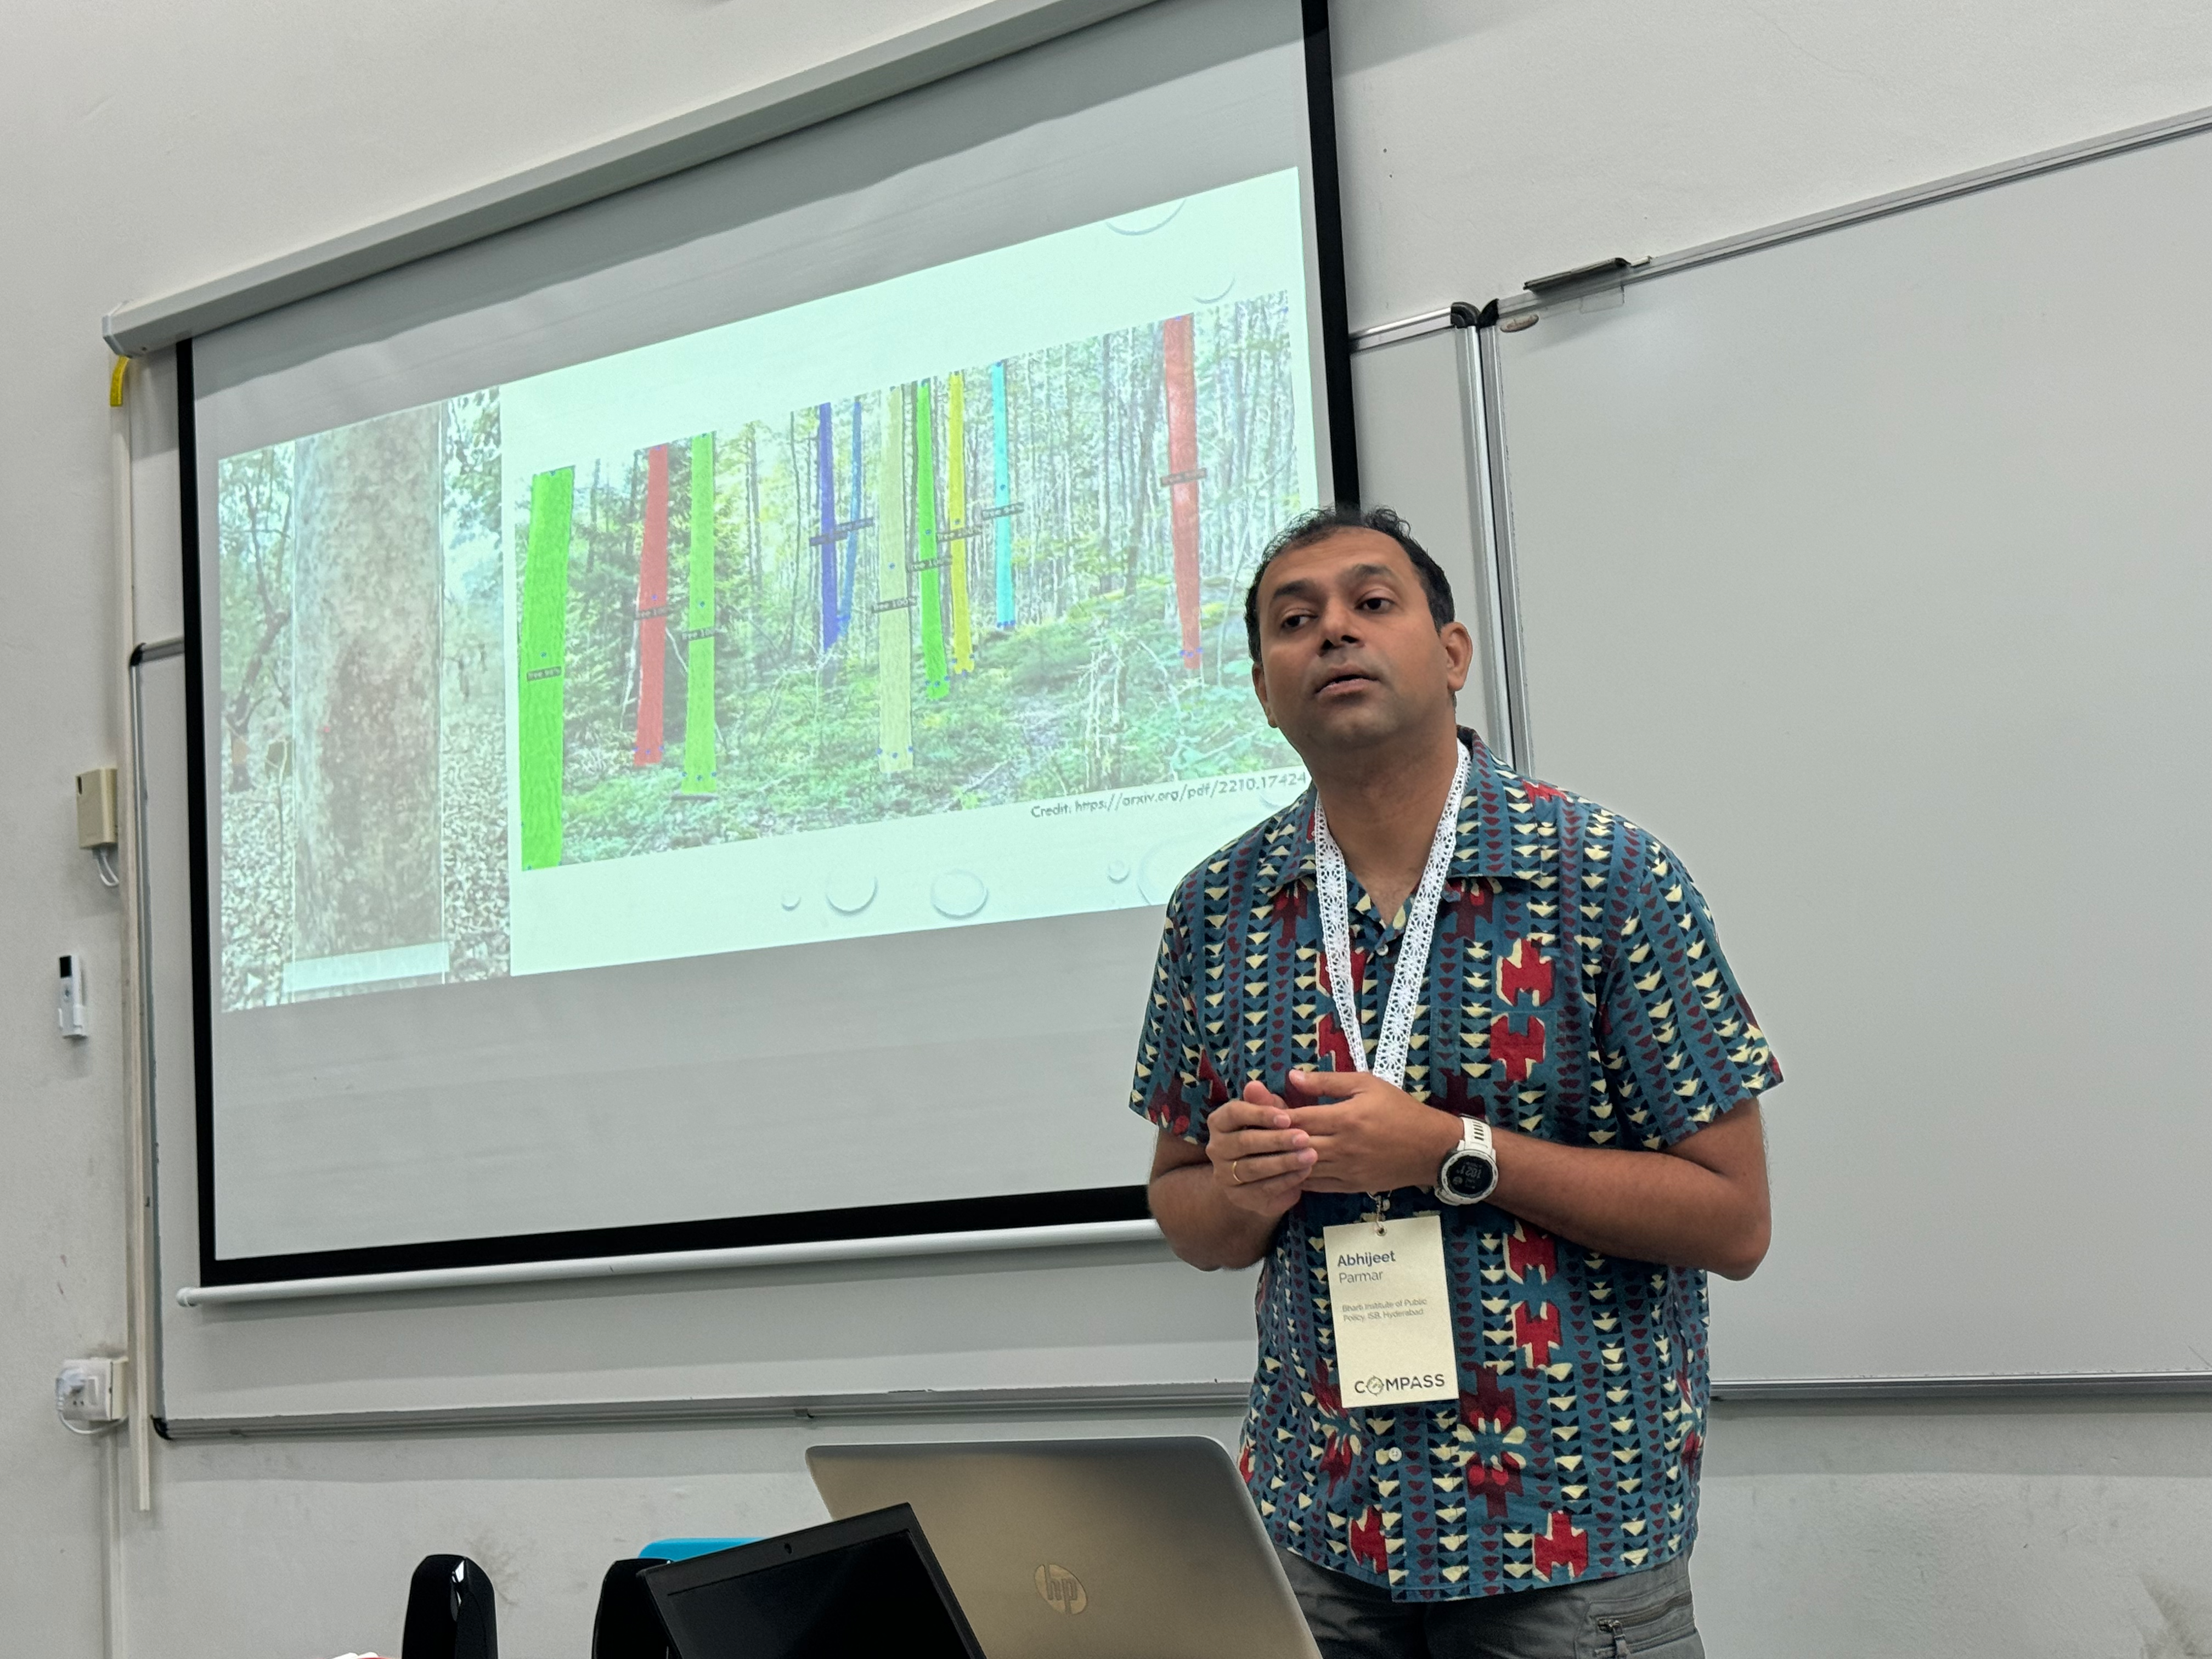
The speaker highlighted the importance of scalability in approaches, particularly in the context of technological applications. Applications must remain simple, grounded in community needs, and usable by the general public. A key problem discussed was the extraction of Above-Ground Biomass (AGB) using smartphone cameras while traversing forested areas. Traditional Lidar-based systems, though effective in providing detailed depth information, are deemed impractical due to the specialised equipment required.
The proposed solution involves creating a Self-Supervised Learning (SSL) model that utilises mobile phones to conduct real-time segmentation of individual trees as one walks through a forest. This approach leverages a pre-trained segmentation model alongside advanced modelling and tagging processes.
The development involves three distinct pipelines, which could be integrated into a single application in the future. Consideration must be given to the UI design to ensure accessibility and effectiveness by rural populations. Advancements in data collection, benchmarking, and pipeline development suggest that such technology could support large-scale forest management initiatives, particularly in public policy contexts. The initial testing phase of this model is being conducted under controlled conditions, including specific lighting and seasonal factors, with plans to extend its applicability.
During the discussion, a question was raised regarding the allocation of funds for tree planting initiatives and identifying a starting point. Answer: it was suggested that bamboo, a valuable resource for biofuel production, could be a focal point. The Indian landscape has sufficient bamboo to meet current biofuel demand, and directing Corporate Social Responsibility (CSR) funds towards this effort could significantly expedite progress.
During a break later I showed
Plantation monitoring for drone images, Snehasis Mukherjee (SNU)
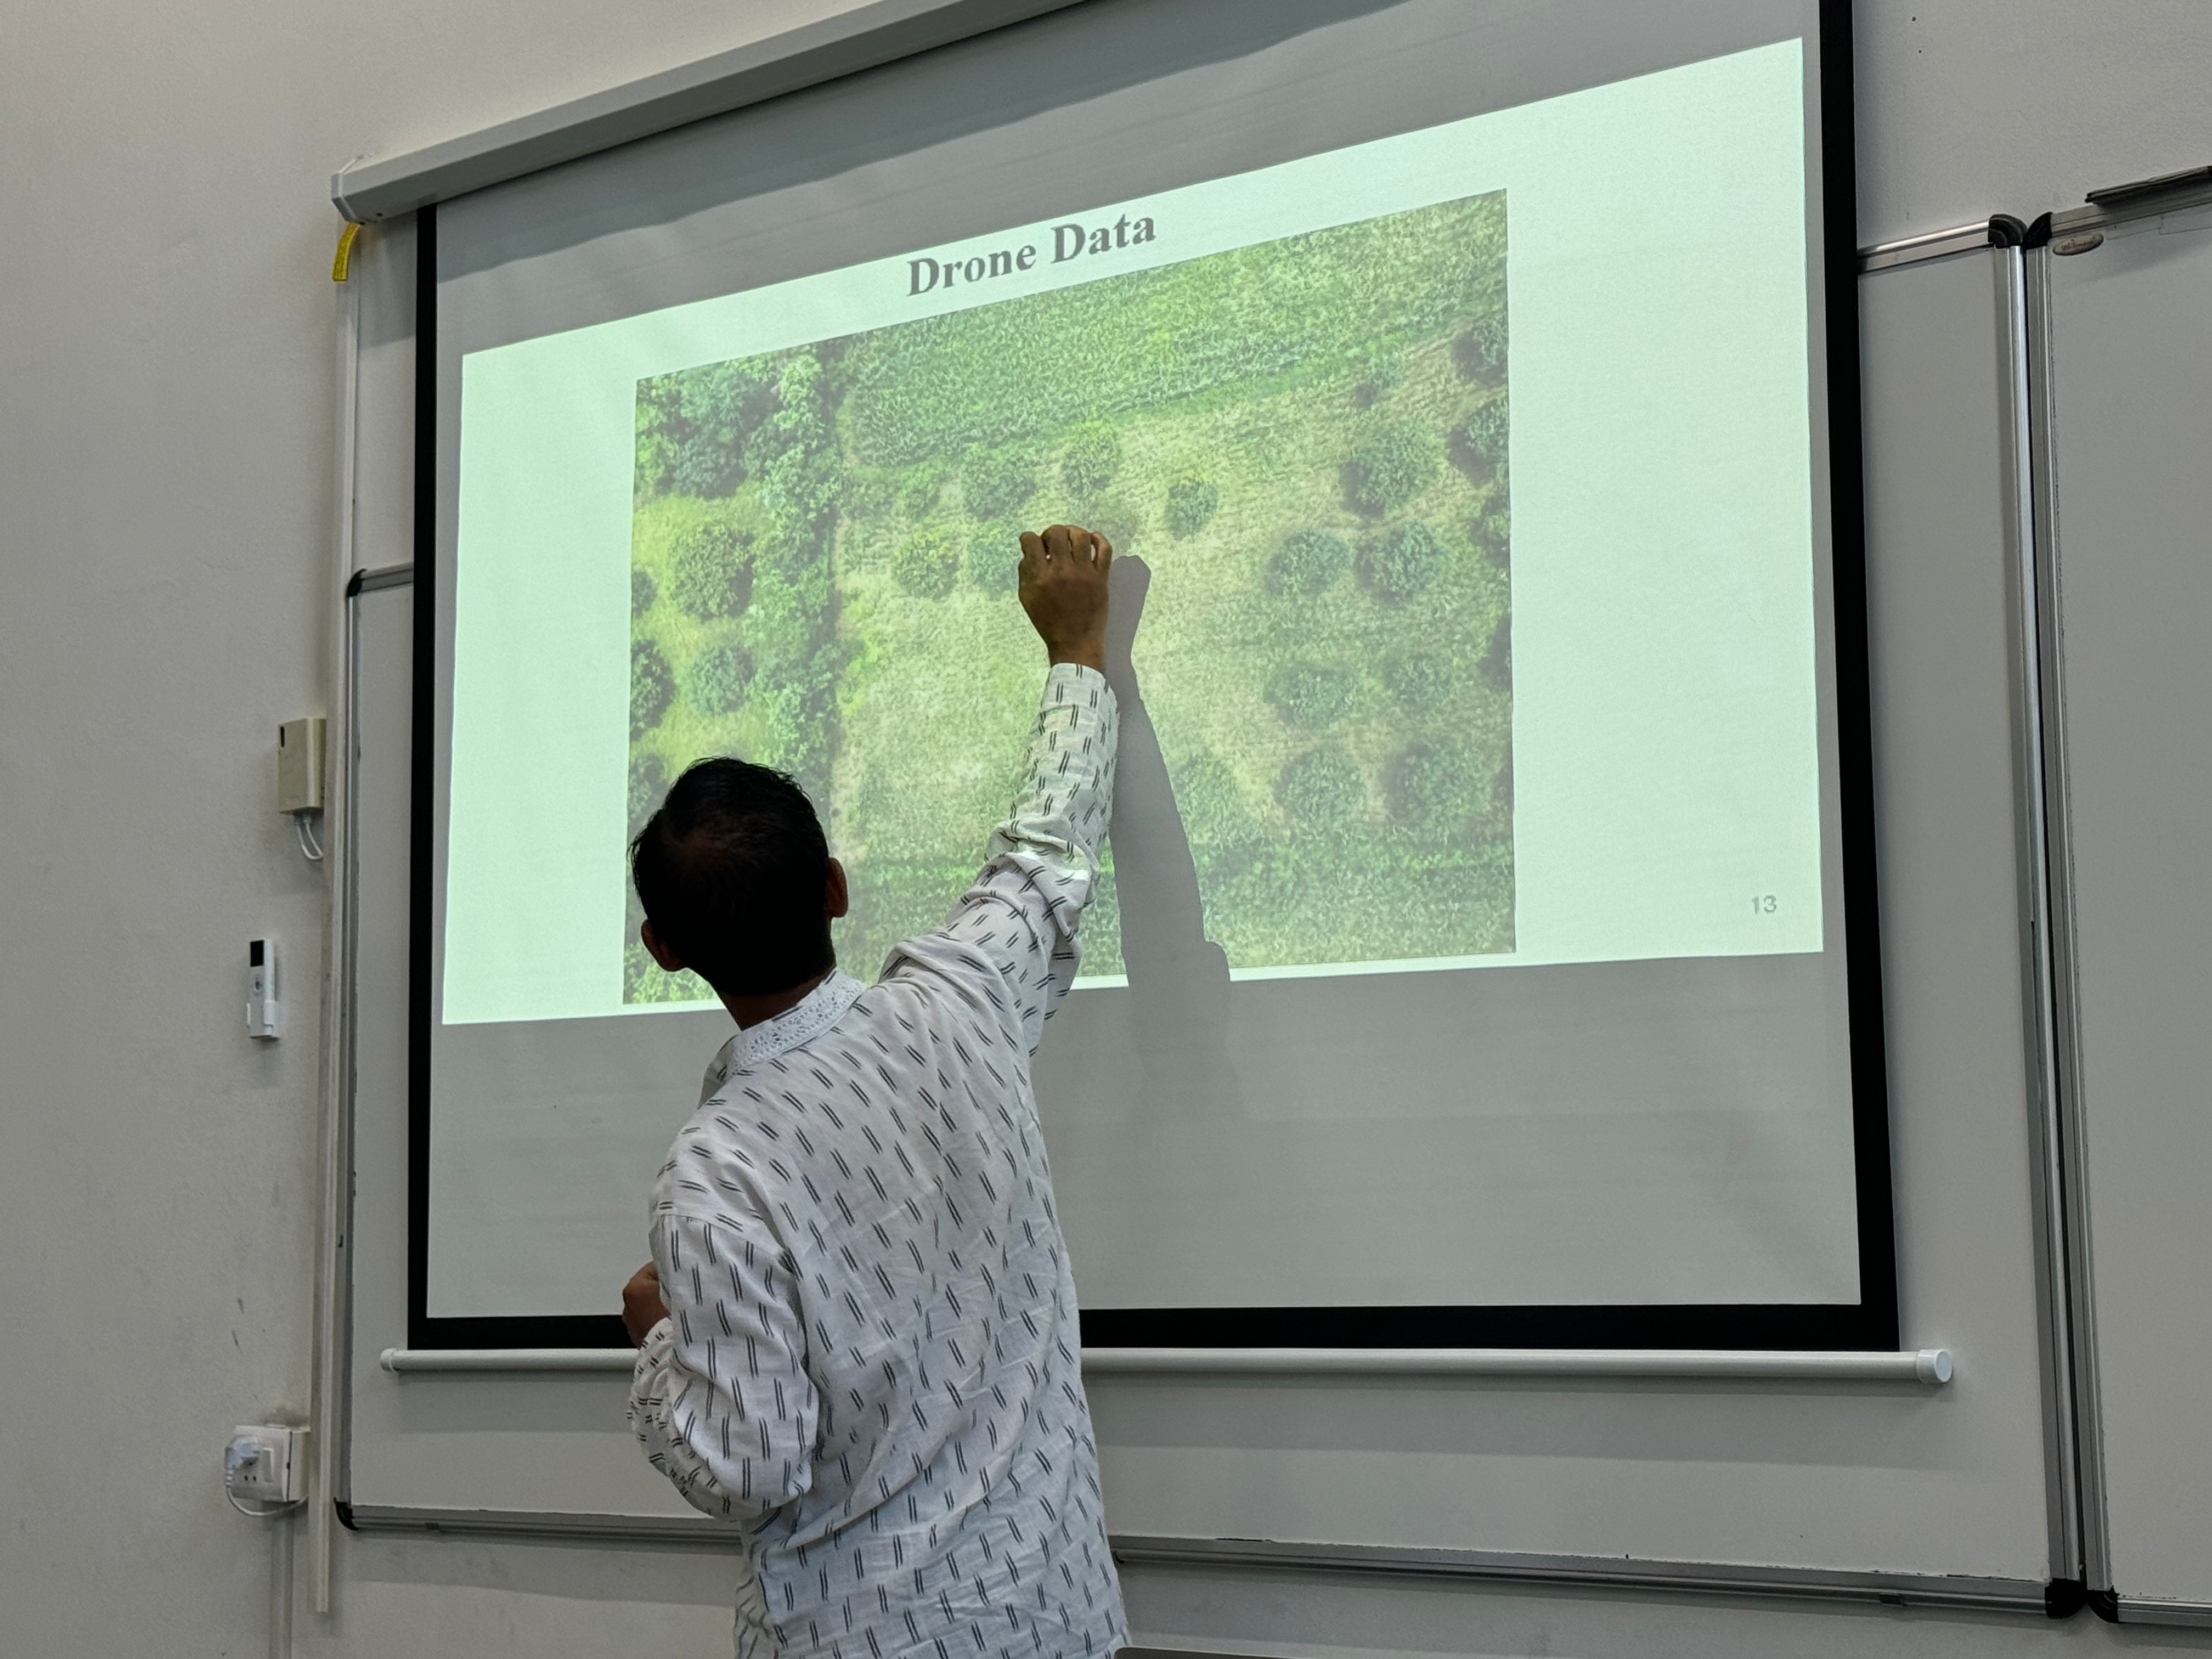
For drone imagery, the low-cost DJI Mini 2 with an RGB camera was chosen. Heights of 50-100m proved effective for capturing plantation images with sufficient resolution. The use cases include crop area estimation, classification, and monitoring plantation health. The first field trip occurred in Aug 2023 in Vittalpur village near Hyderabad, resulting in 253 usable images at ~50m (mainly of plantations).
Image annotation was labor-intensive, with 100 images annotated by the team and 150 outsourced for ₹1000, resulting in approximately 9000 annotations. The Xception and ResNet50 models showed promising results with reduced overfitting, and 2000 acres have been mapped now with multiple tree varieties. The challenge remains on how to supplement limited drone imagery with lower-resolution satellite images, since flying drones is expensive.
Forestry Agroforestry and Restoration Toolkit using Technology and Community Participation - Ashish Kumar
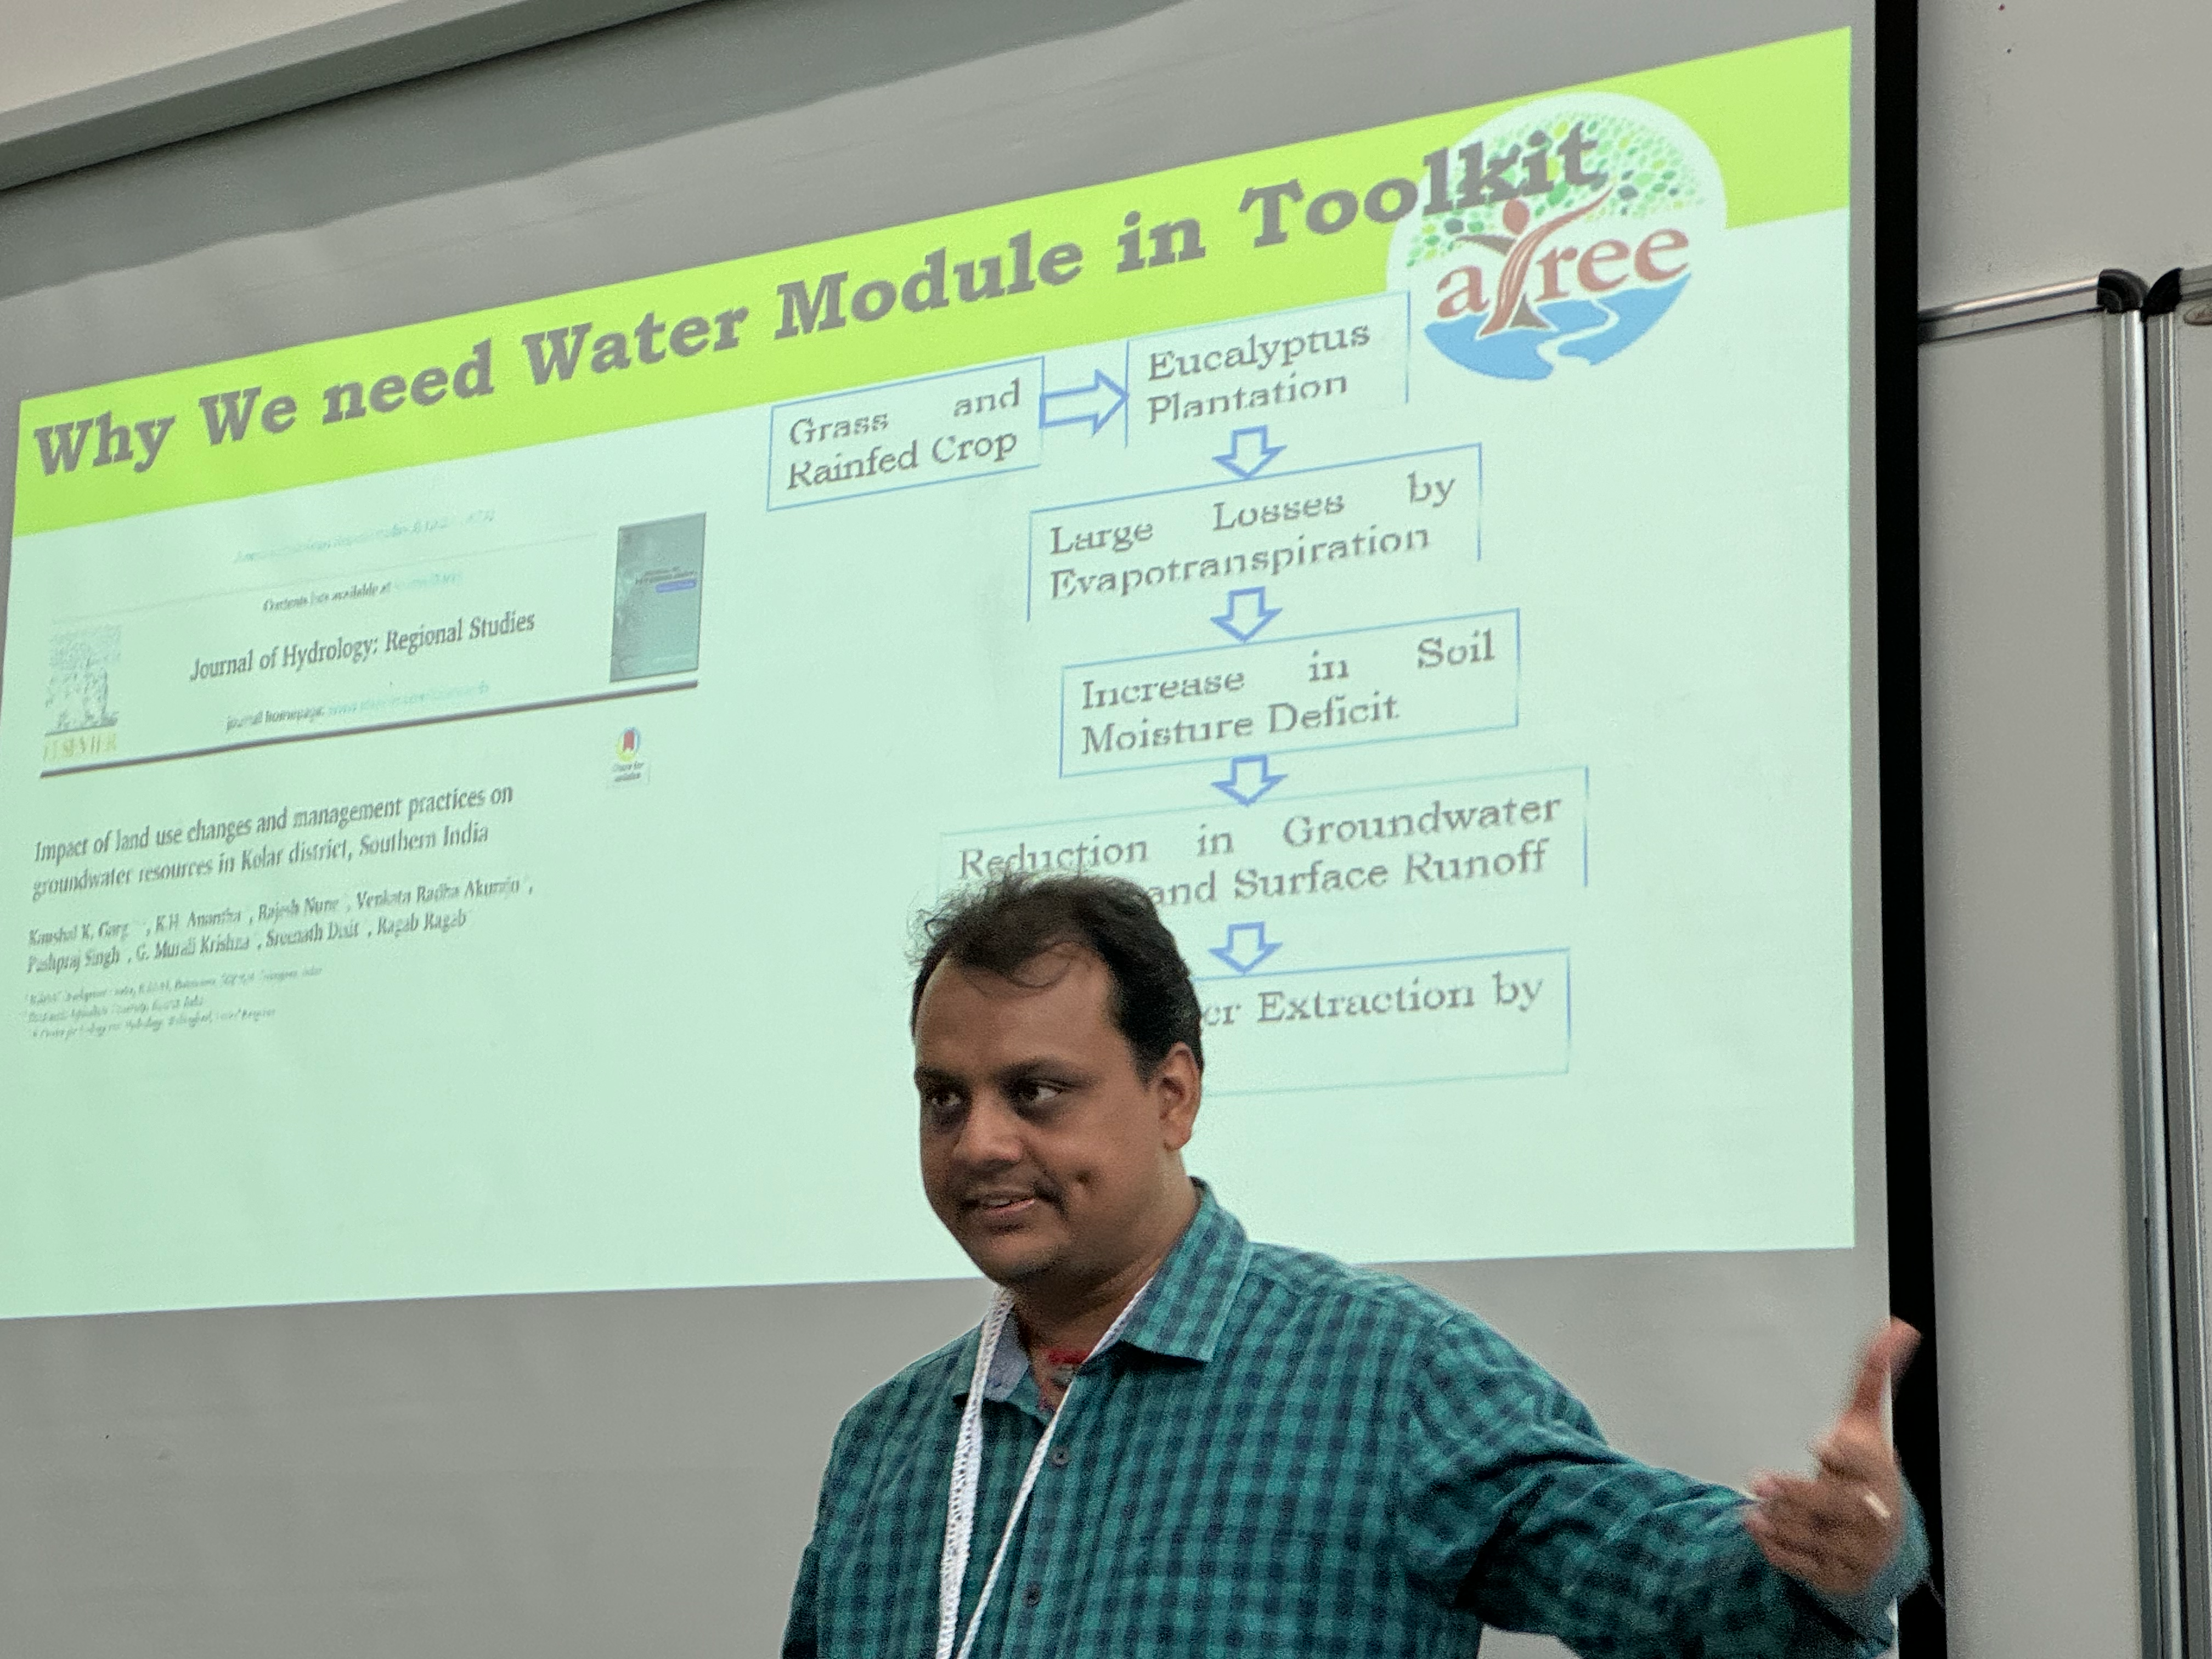
The project includes several modules: Species Distribution Modelling (SDM), water management, carbon sequestration, and economic analysis. Water management is particularly critical and is informed by research from the Kolar district, which has experienced declining groundwater levels since the 1990s and exacerbated by increasing demand. Remote sensing data shows significant variation in water usage depending on plant type and location (e.g., mango vs eucalyptus).
Their work utilised the SSEBOP evapotranspiration product, accessed via Google Earth Engine (GEE), to analyse water use and its implications for agroforestry efforts.
Riverbed sand mining activity detection based on satellite imagery - Siddharth Agarwal
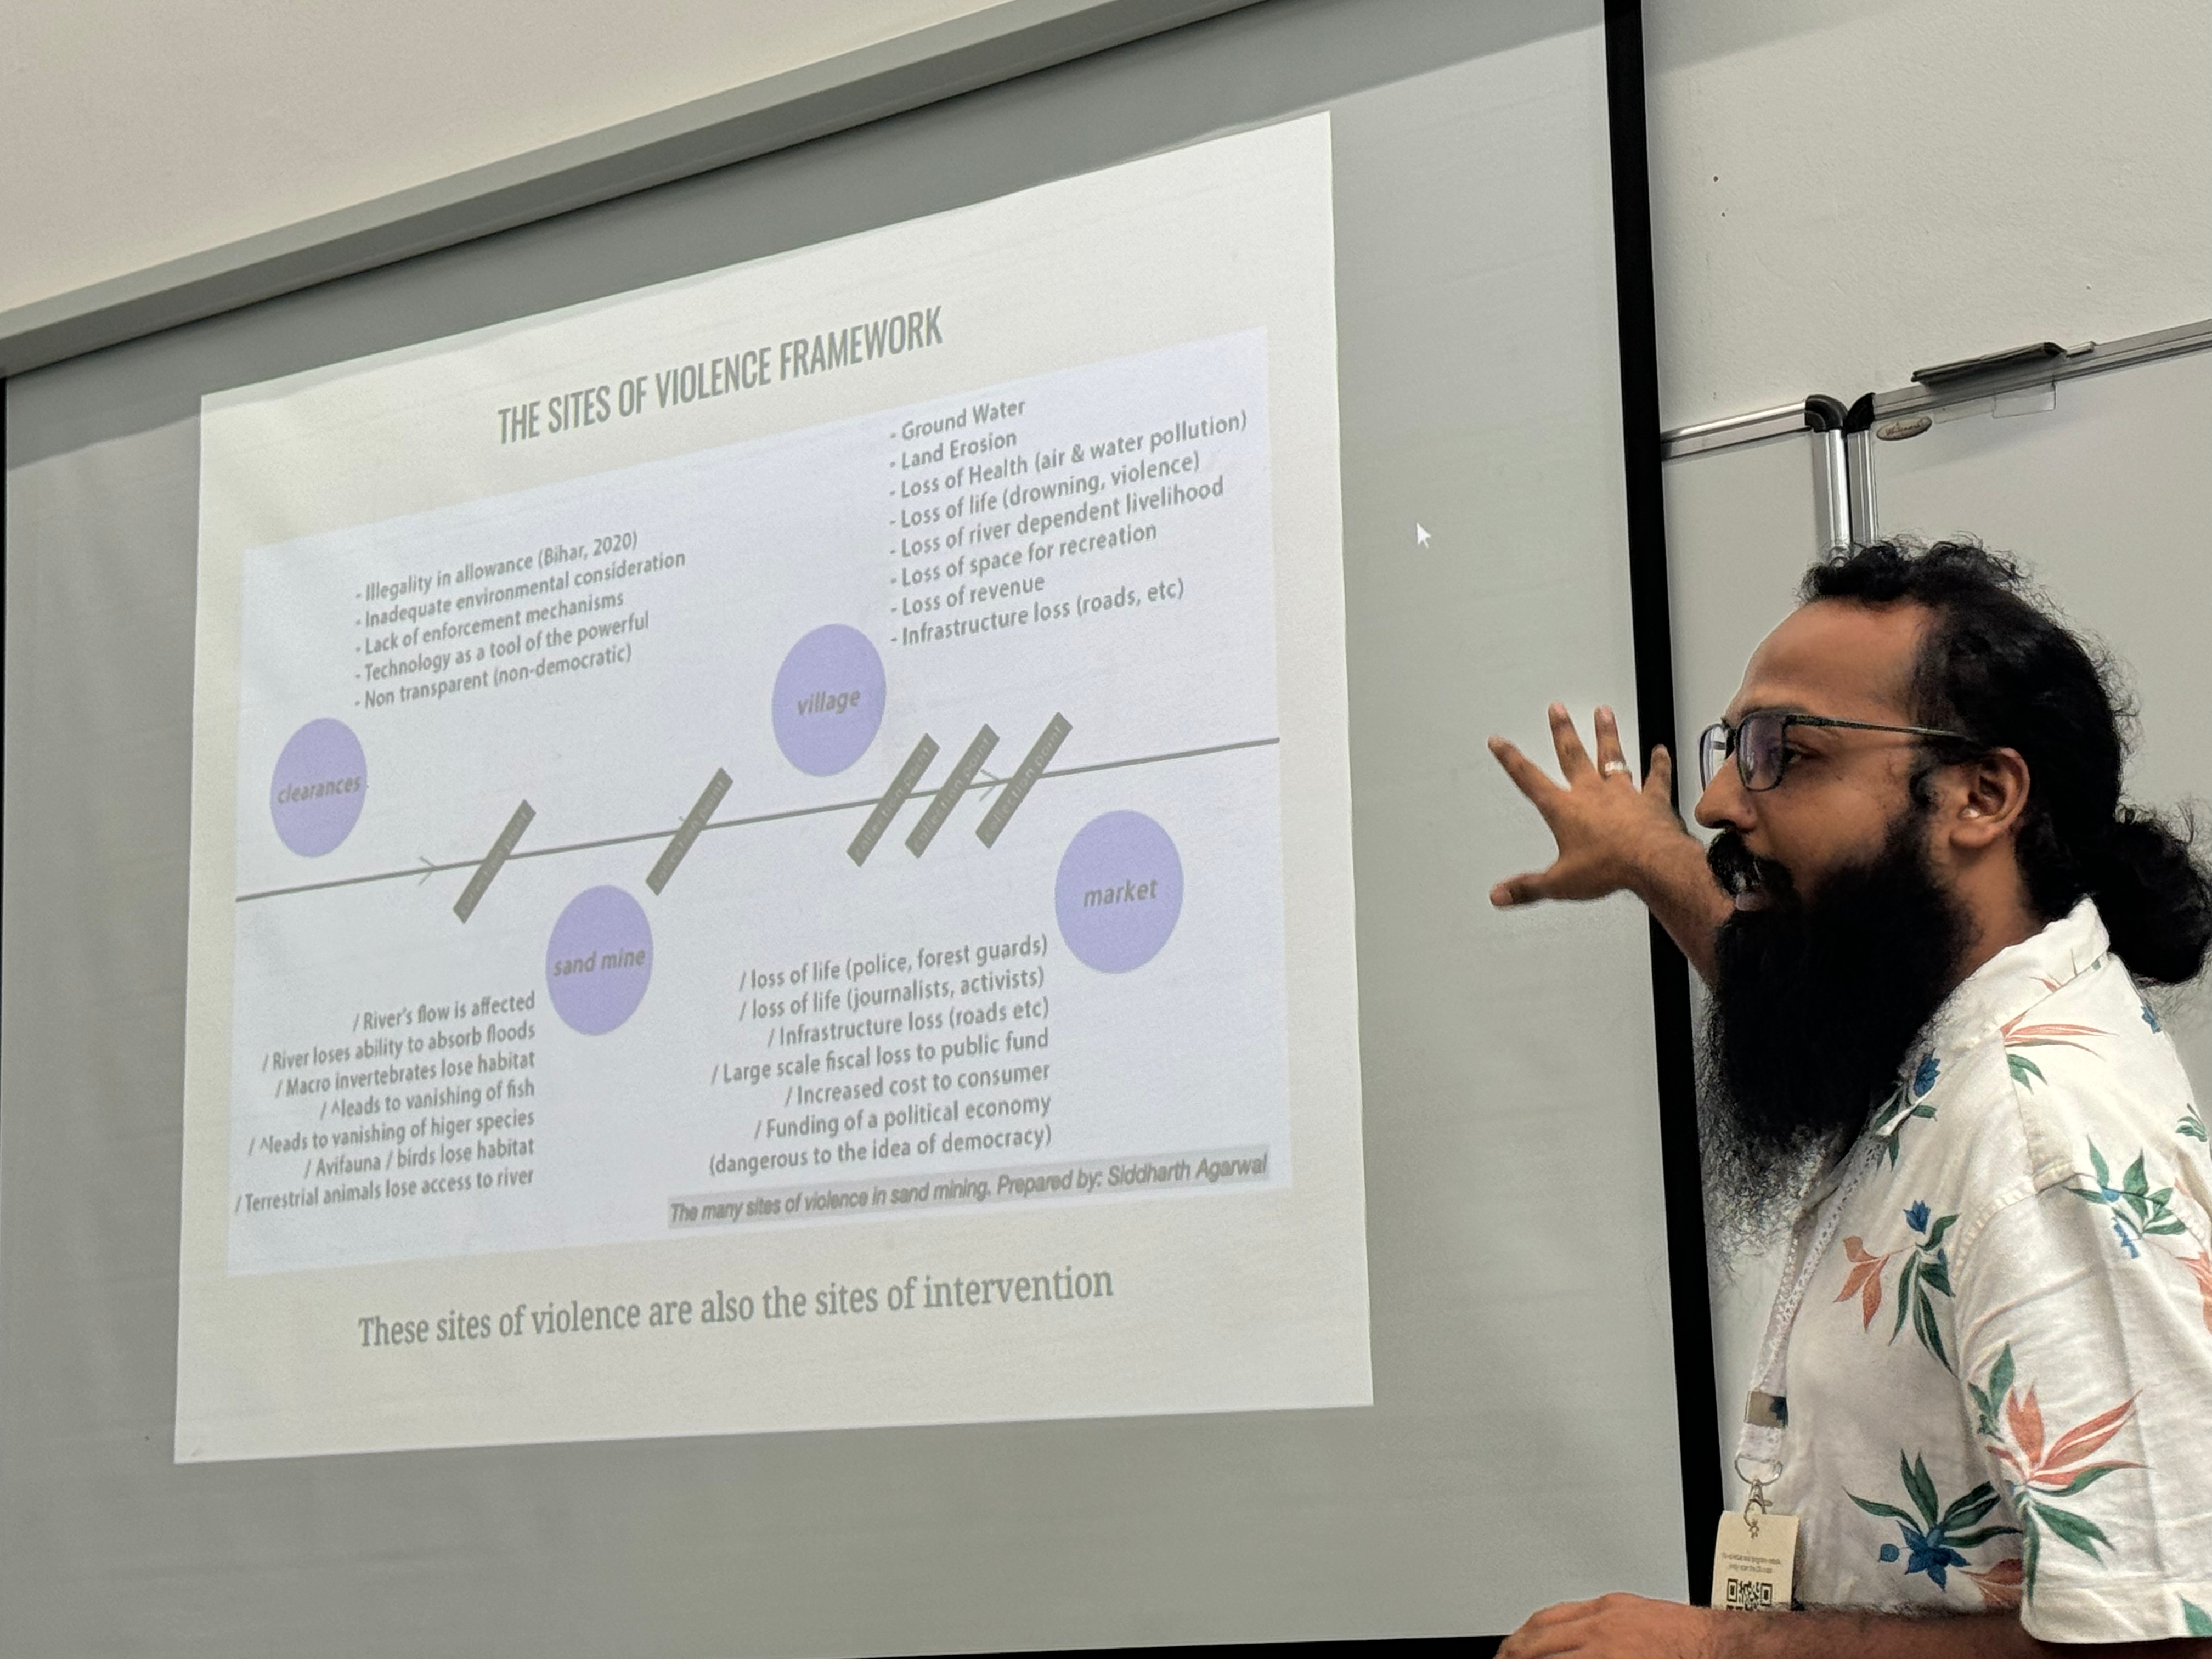
Focussing on detecting riverbed sand mining activities using satellite imagery, particularly in areas where on-site visits are impractical. It turns out that sand is the second most extracted material globally after water, and its mining is a significant environmental concern especially for river communities. The project aims to develop a machine learning model to detect such mining activities using S1/S2 (didn't catch which, or both) satellite data.
India Sand Watch, an open data platform developed with Ooloi Labs, aims to collect annotate and archive data related to sand mining in India. This emerged due to the high costs associated with using detailed satellite imagery and processing and the need to understand sand mining comprehensively. The project covers the entire sand mining process, from discovery and land auctions to clearances and mining, and includes a 'sites of violence' framework that identifies intervention points.
Significant challenge identified was the readability of documents associated with planning, which can be difficult even for humans let alone LLMs, making digitisation and structuring of data crucial. The transition from discovery to the actual mining site often involves navigating poorly accessible documents, highlighting the need for better evidence pipelines. Note to self: just like our
They are in collaboration with Berkeley with the aim to develop a machine learning model that predicts mining activity using low-resolution imagery (thus saving costs), covering vast areas (up to 10000 km2+) with Sentinel-1/2 as base maps. Their goal is to combine this data to create large-scale evidence that can then be used to drive large-scale action. This approach has been validated in court, where the data was accepted as evidence by the National Green Tribunal (NGT).
Q: is the community getting involved? A: The initiative began with community action, reflecting concerns over sand mining's impact on ecosystems, as sand is the second most extracted material globally after water.
Session 2
Proposal for a new interactive electronic publication standard - R. Nandakumar
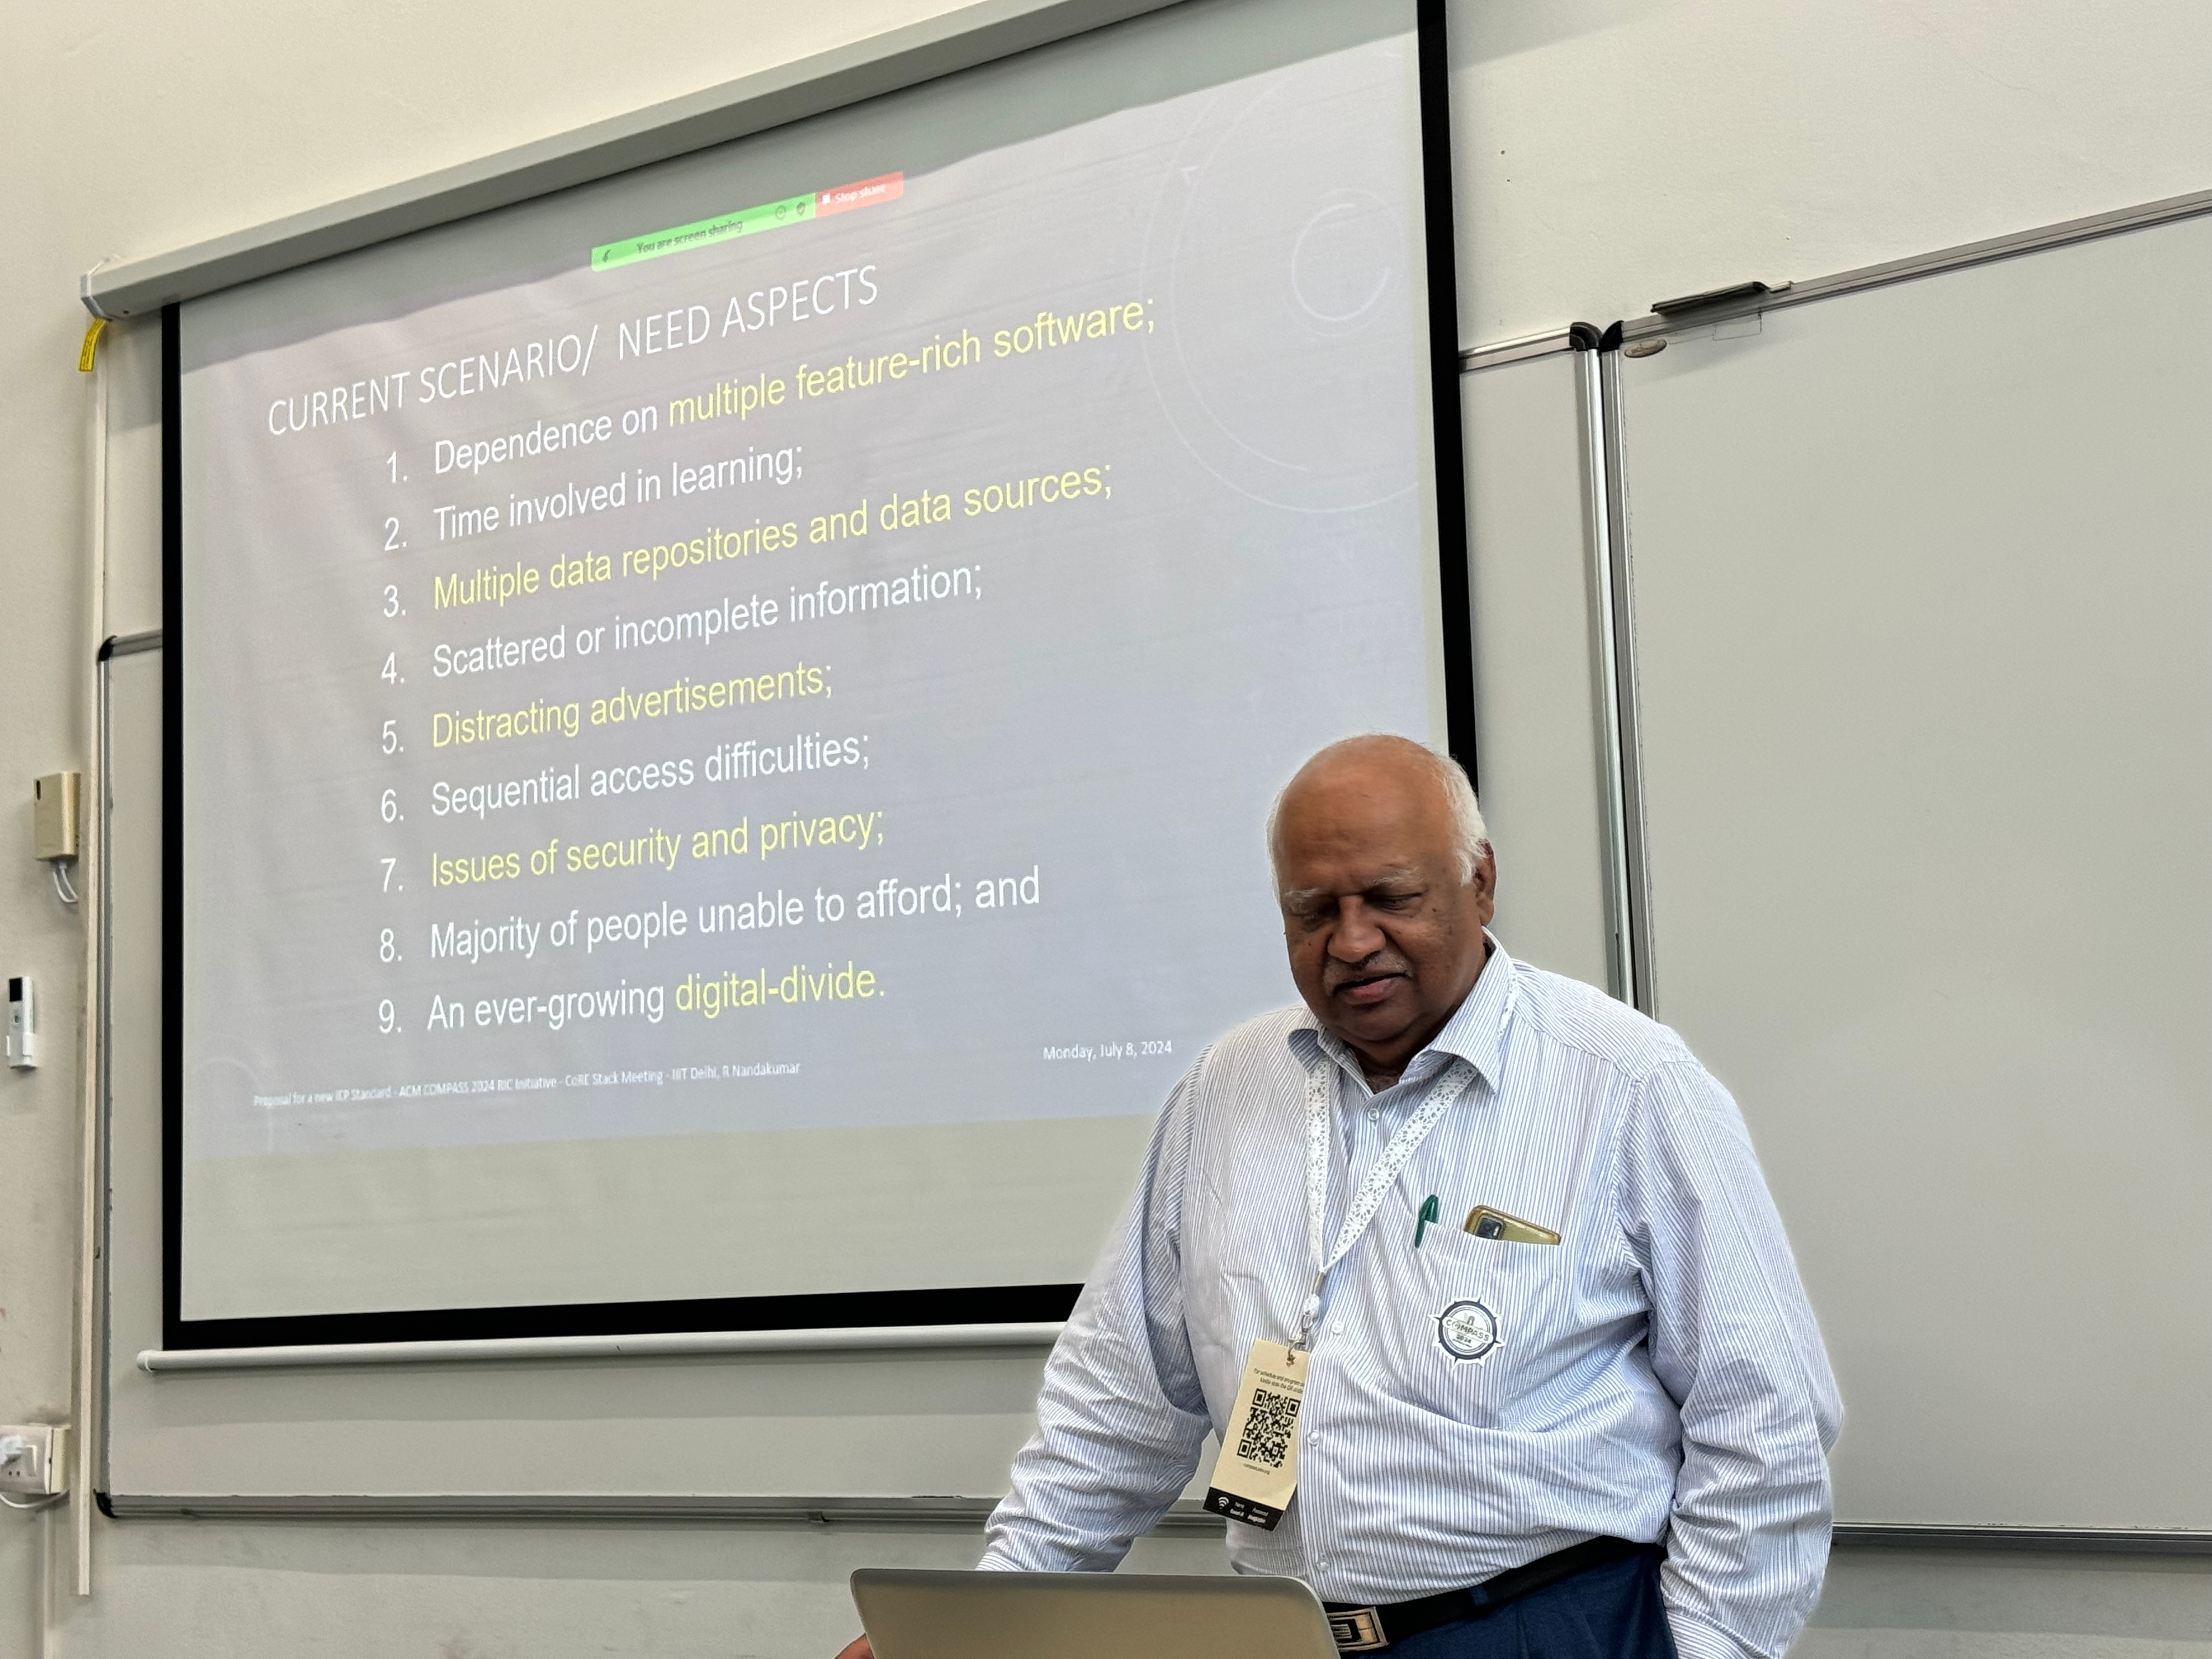
He highlighted several issues with existing formats; inadequate representation of images, maps, infographics, and spreadsheets, and the absence of interactive features like running commentaries during visualisation animations. Also, there is a lack of fine printing and zoom capabilities and flexible authorisation mechanisms.
His proposal suggests evolving existing standards (like PDFs) into more interactive and self-contained formats that include code. First phase would extend 2D image maps to support animations and metadata while embedding free and open-source software within the PDF. The second phase could expand this to include 3D models.
The end goal is to standardise interactions across various formats—image maps, spreadsheets, infographics, animations, and audiovisual content—using the ISO/IEC 25010 square standard, which provides a comprehensive framework for functionality, performance, compatibility, usability, reliability, security, maintainability, and portability. (see slides for more details on each of these)
My mad idea: might we build a WASM interpreter in JavaScript so that it can run inside the existing PDF JS interpreter and work with existing docs? WASI for PDF! I've got a project idea relevant to this that can perhaps be extended or forked; see
Geospatial data standards to enable co-creation of data products (Craig Dsouza)
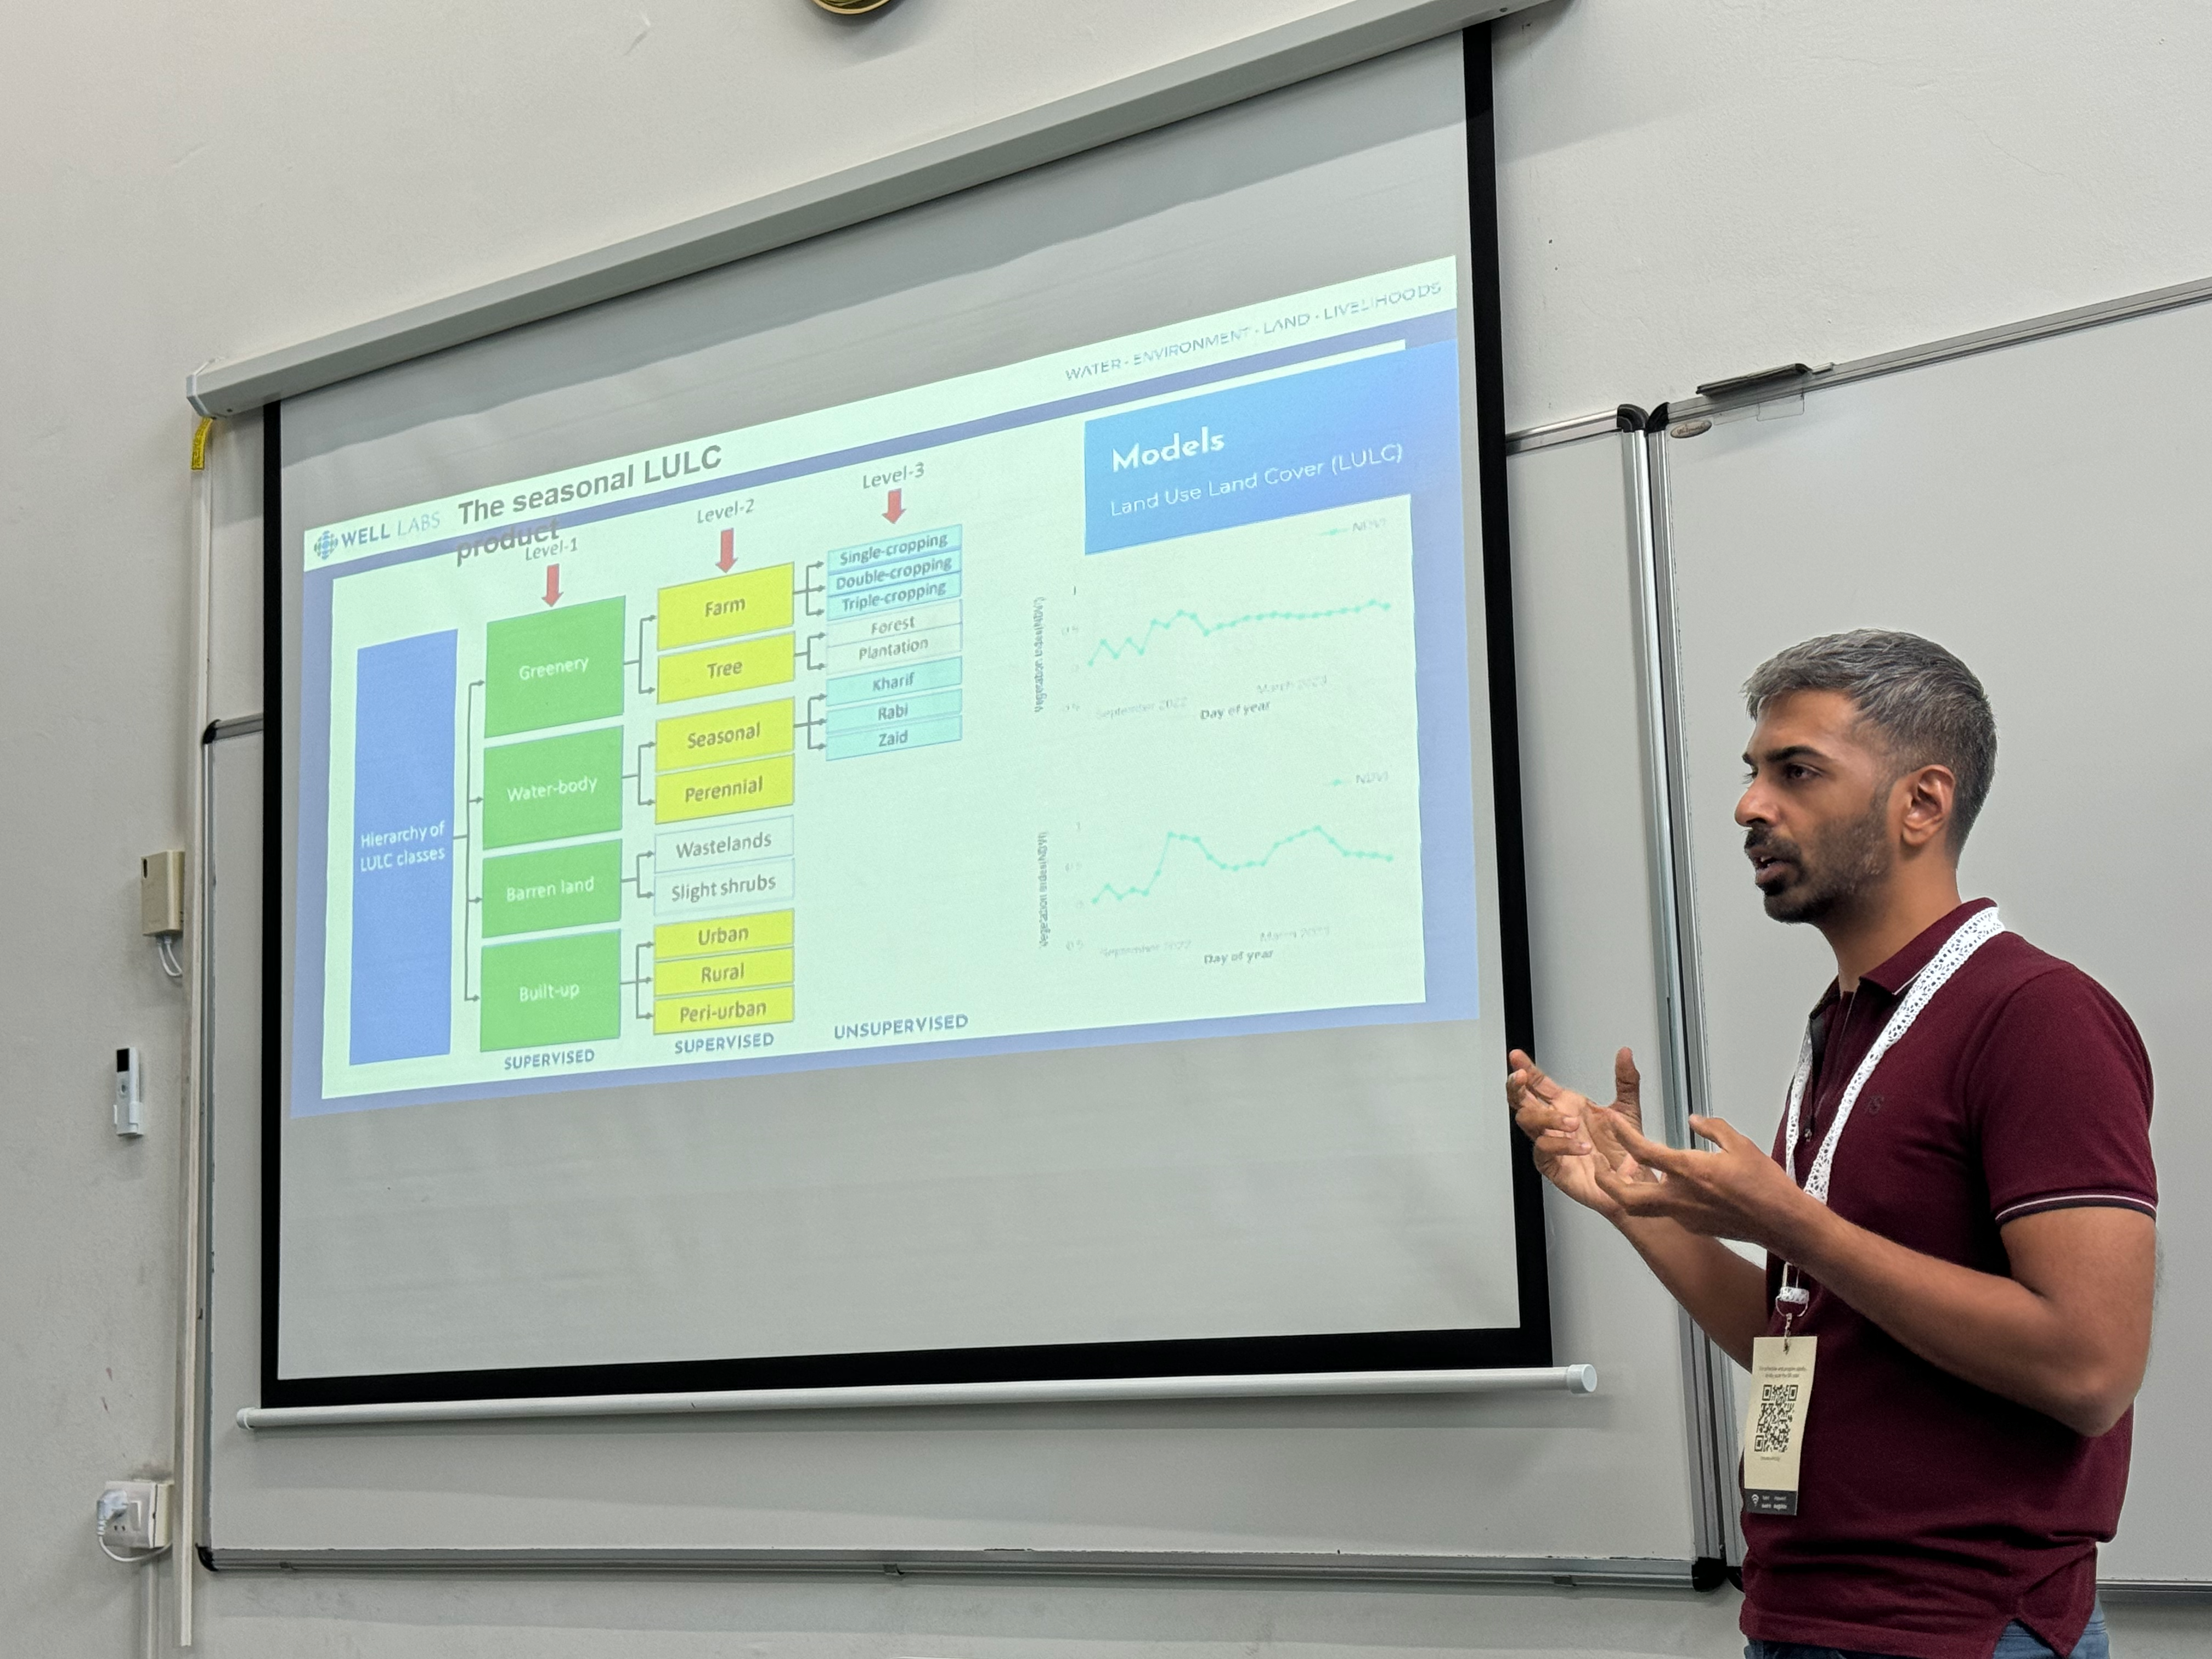
There is an overload of data and algorithms in all directions, so we want to accelerate development of better data and algorithms rather than quantity. How do we increase trust and reduce friction in the source data and eventual results with rural communities? Existing domain specific standards do exist, but they either dont exist or aren't widely adopted (see previous talk), especially for natural resource managemen where it can be of different modalities/resolution and some commonality exists but also sector specific extensions are required from current standards to deal with local variability.
So they are surveying data standards and algorithm standards. To consider data standards first, the most successful is Open Street Map. For algorithm standards, there is rapidly adopted services like HuggingFace. But what is the combination of both so that they can be coupled to real outcomes?
How do we compare the performance of data standards and build guiding principles of which ones to pick?
- to reduce friction:
- consider the time taken for dataset and model integration with existing open source tools
- or the time taken for the end user to create a new dummy datapoint.
- time taken for end user to run the model and make the first minor fix.
- to accelerate development:
- number of collaborators over time
- number of additions by 3rd parties over time
- increase in model performance over time
An existing example is how to share a LULC dataset using existing open geospatial standards (STAC). The data standard creates a simple JSON file which has metadata for that module. The data user can then access to eh latest version of the data via either an API or the STAC browser.
TODO for myself: Look at mapping these metrics onto our TMF pipeline (in
Geospatial data flow management - Anil Madhavapeddy
My talk, I was speaking, so no notes! I'll upload the slides later and edit this section.
Good question from the audience about healthcare management and its relevance to planetary computing -- it seems to share a lot of the problems involving data sensitivity and the need for spatially explicit data sharing.
Opportunities in agricultural sensing - Anupam Sobti
Anupan introduced the main questions across the rural farming cycle including:
- Sowing: "Is this the right crop?" "Will I have enough resources (water, heat, seeds)?" "Are these the right seeds?"
- Harvesting: "Is this the right time to harvest?" "How do I plan post-harvest logistics?" "How do I manage residue?"
- Selling: "Is this the right time to sell?" "Who do I trust to sell to?" "Do I sell now or wait?"
So onto the notion of "Agricultural Computing", which:
- involves multiple decision layers: farmer-centric, government-centric, and finance-centric.
- features recent innovations such as advancements in remote sensing and game theory applications to navigate complex agricultural decisions.
Urban heat islands are a significant problem detectable with geospatial data. He noted the reference of paper by Mohajerani, Abbas, Jason Bakaric, and Tristan Jeffrey-Bailey. "The urban heat island effect, its causes, and mitigation, with reference to the thermal properties of asphalt concrete." Journal of Environmental Management 197 (2017): 522-538.
Note to self: Send to
Q: For marginalised communities, should there be standards for interactions to obtain feedback iteratively, reducing the shock of policy changes? A: There is a need for significant groundwork engineering right now to provide immediate feedback, helping communities adapt more smoothly to changes.
Understanding Soil Moisture Regime for Crop Diversification - Prachi D. Patil
Slides
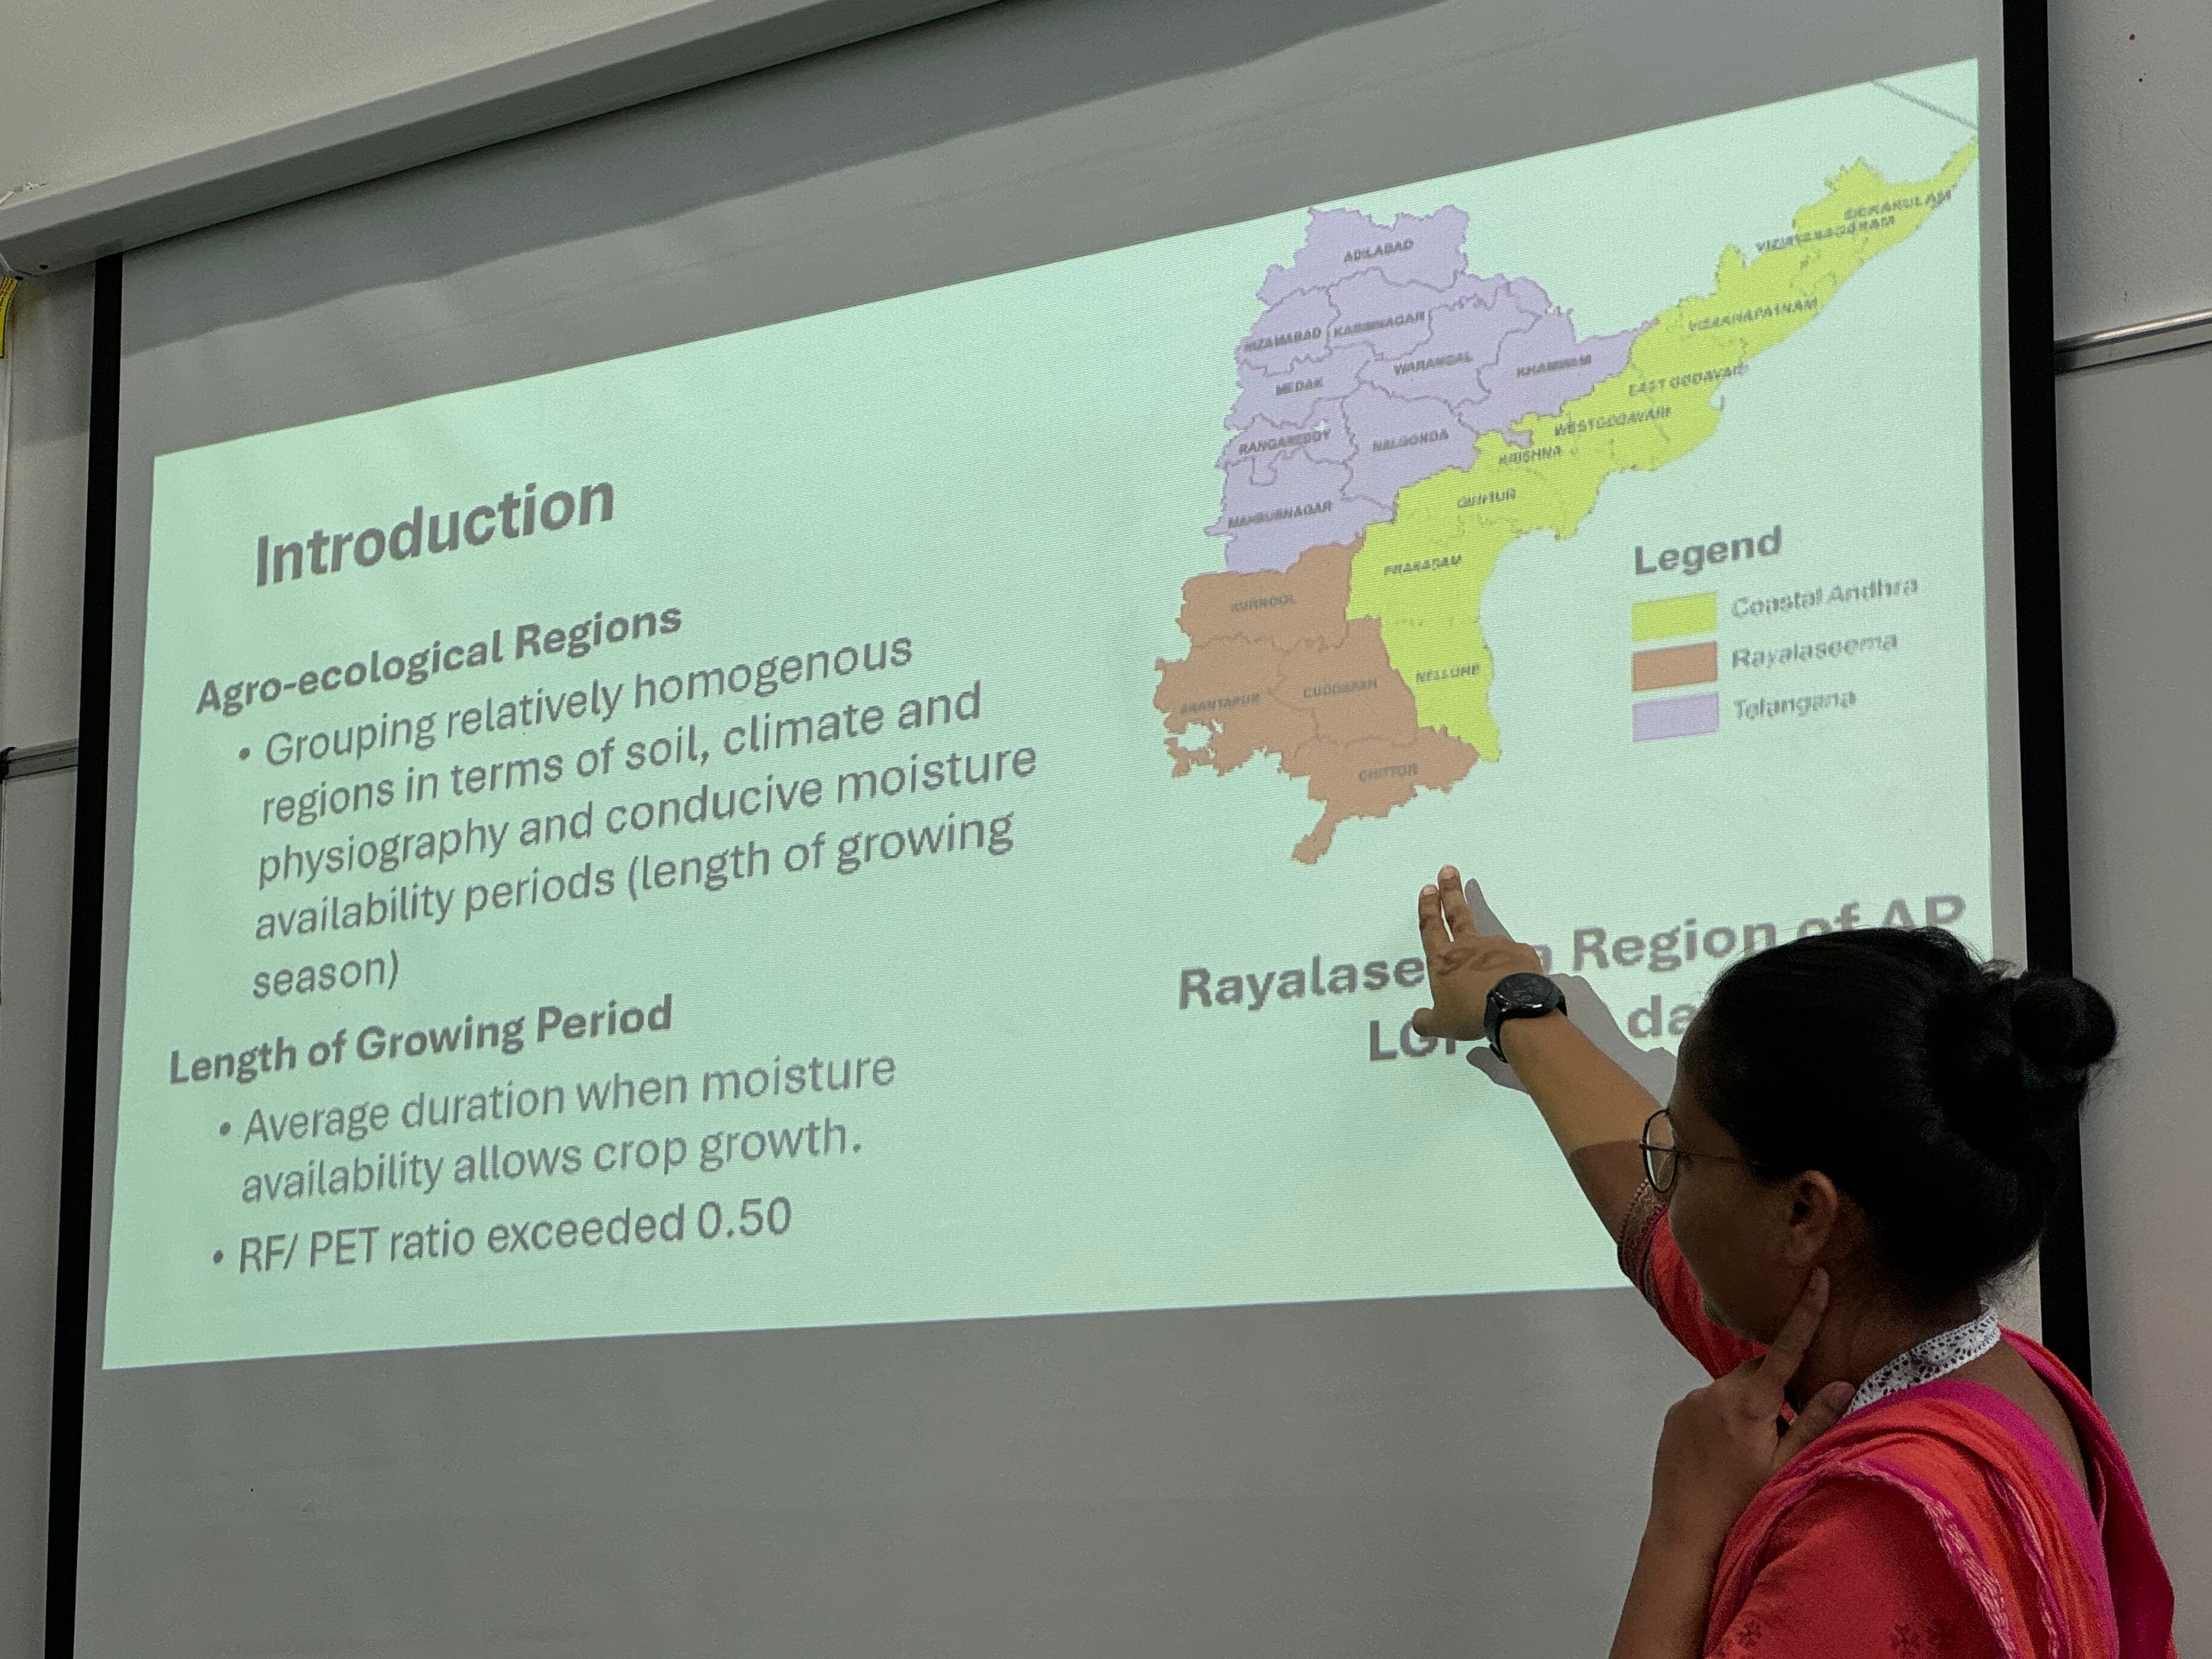
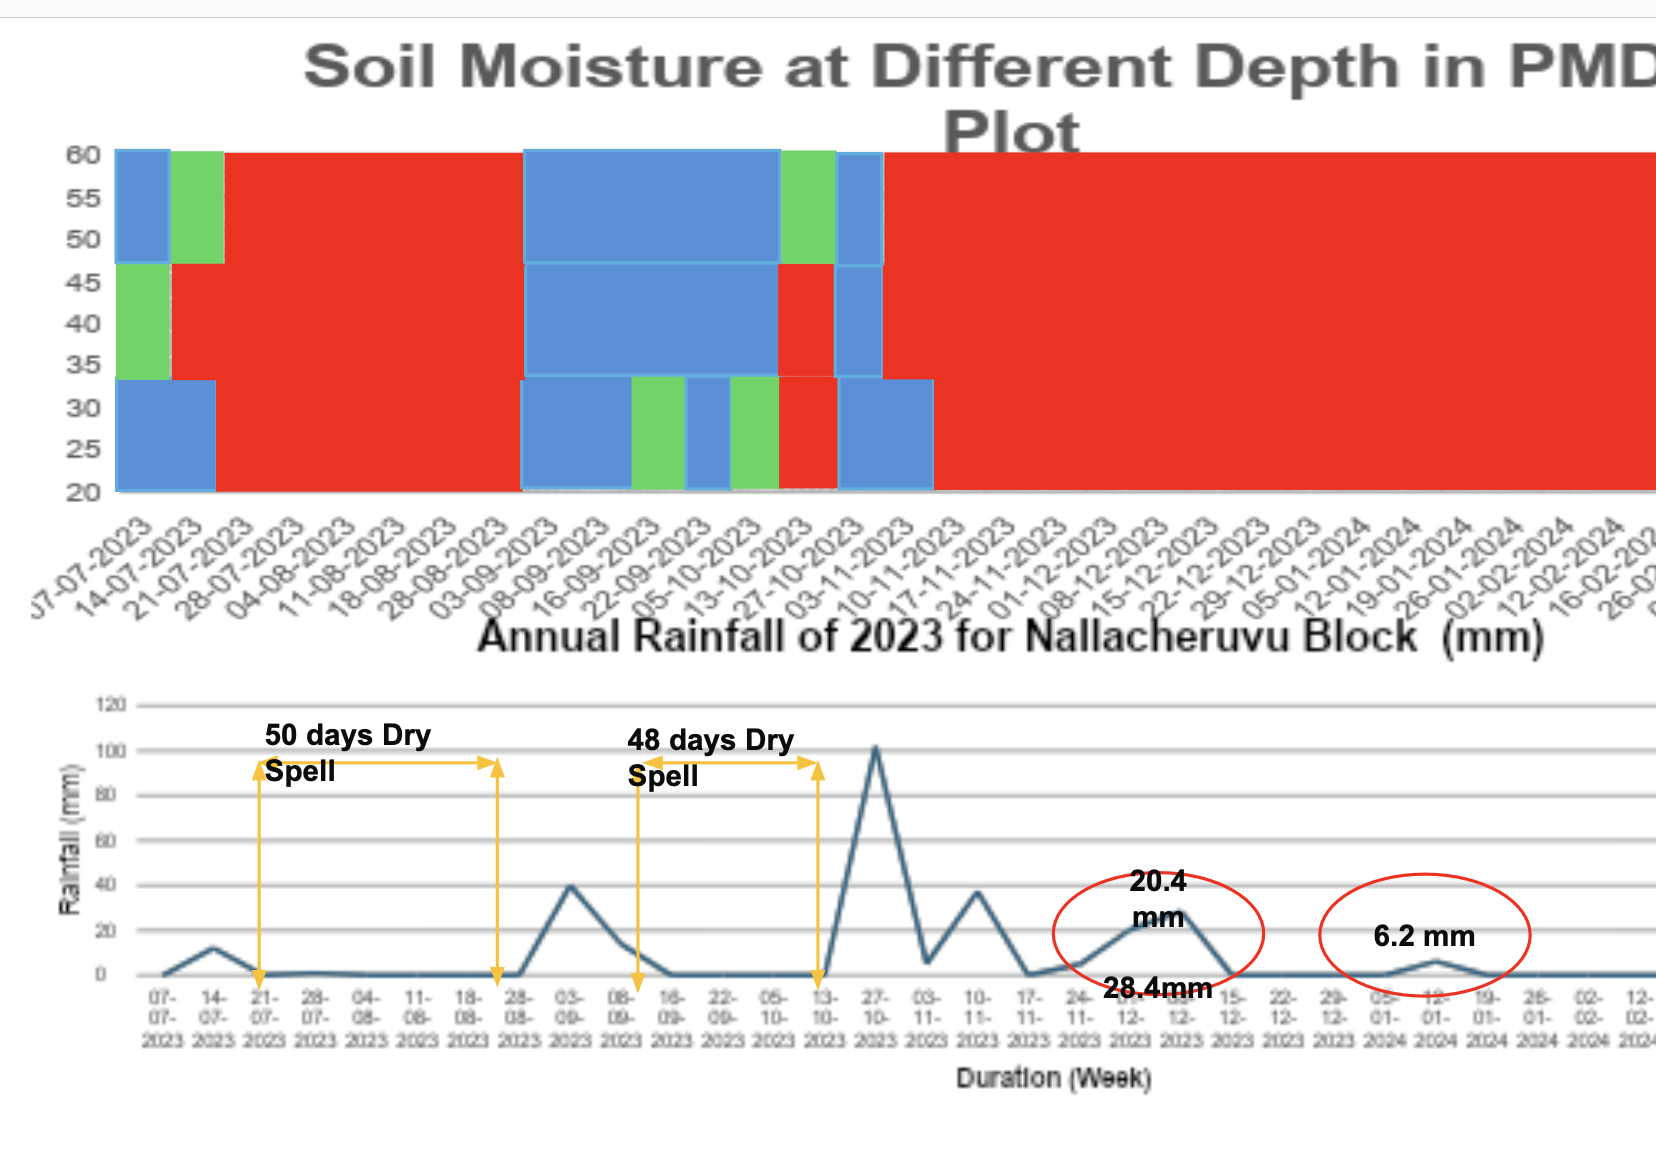
Prachi gave a perspective from the farmer's fields, with a study aiming to group relatively homogenous regions based on soil, climate, and physiography, focusing on moisture availability periods for soil and the length of the growing season. Their approach uses simple moisture sensors at various depths to measure soil resistivity, providing farmers with real-time information on whether to irrigate. This system can map dry spells and their duration, offering actionable insights for crop management.
The Navadhanya system is a traditional cropping method with specific design and crop geometry, which can be analysed for soil moisture as a multidimensional system—both spatially and temporally. Different crops have varying maturity and root depth cycles, making soil moisture critical for establishing and protecting these crops. A fallow period during a critical stage can lead to crop loss and so highlights the importance of consistent moisture.
Navadhanya bridges traditional crop mixing knowledge with modern scientific sensor methods as described in the talk. Navadhanya offers nutritional security through crop variety though farmers typically sell a reliable monocrop in the market. Their analysis suggests a need to consider soil use regimes both in the short and long term, challenging the practice of forcing farmers to switch crops (e.g., from rice to bajra) based on short-term profitability.
Q: How can this tool assist with monsoon management? A: The tool can map soil moisture and integrate it with traditional knowledge, enabling the development of combined solutions for managing monsoon impacts.
Ranking and financing based on climate smart agriculture - Atanu Garai (SocialWell)
Slides
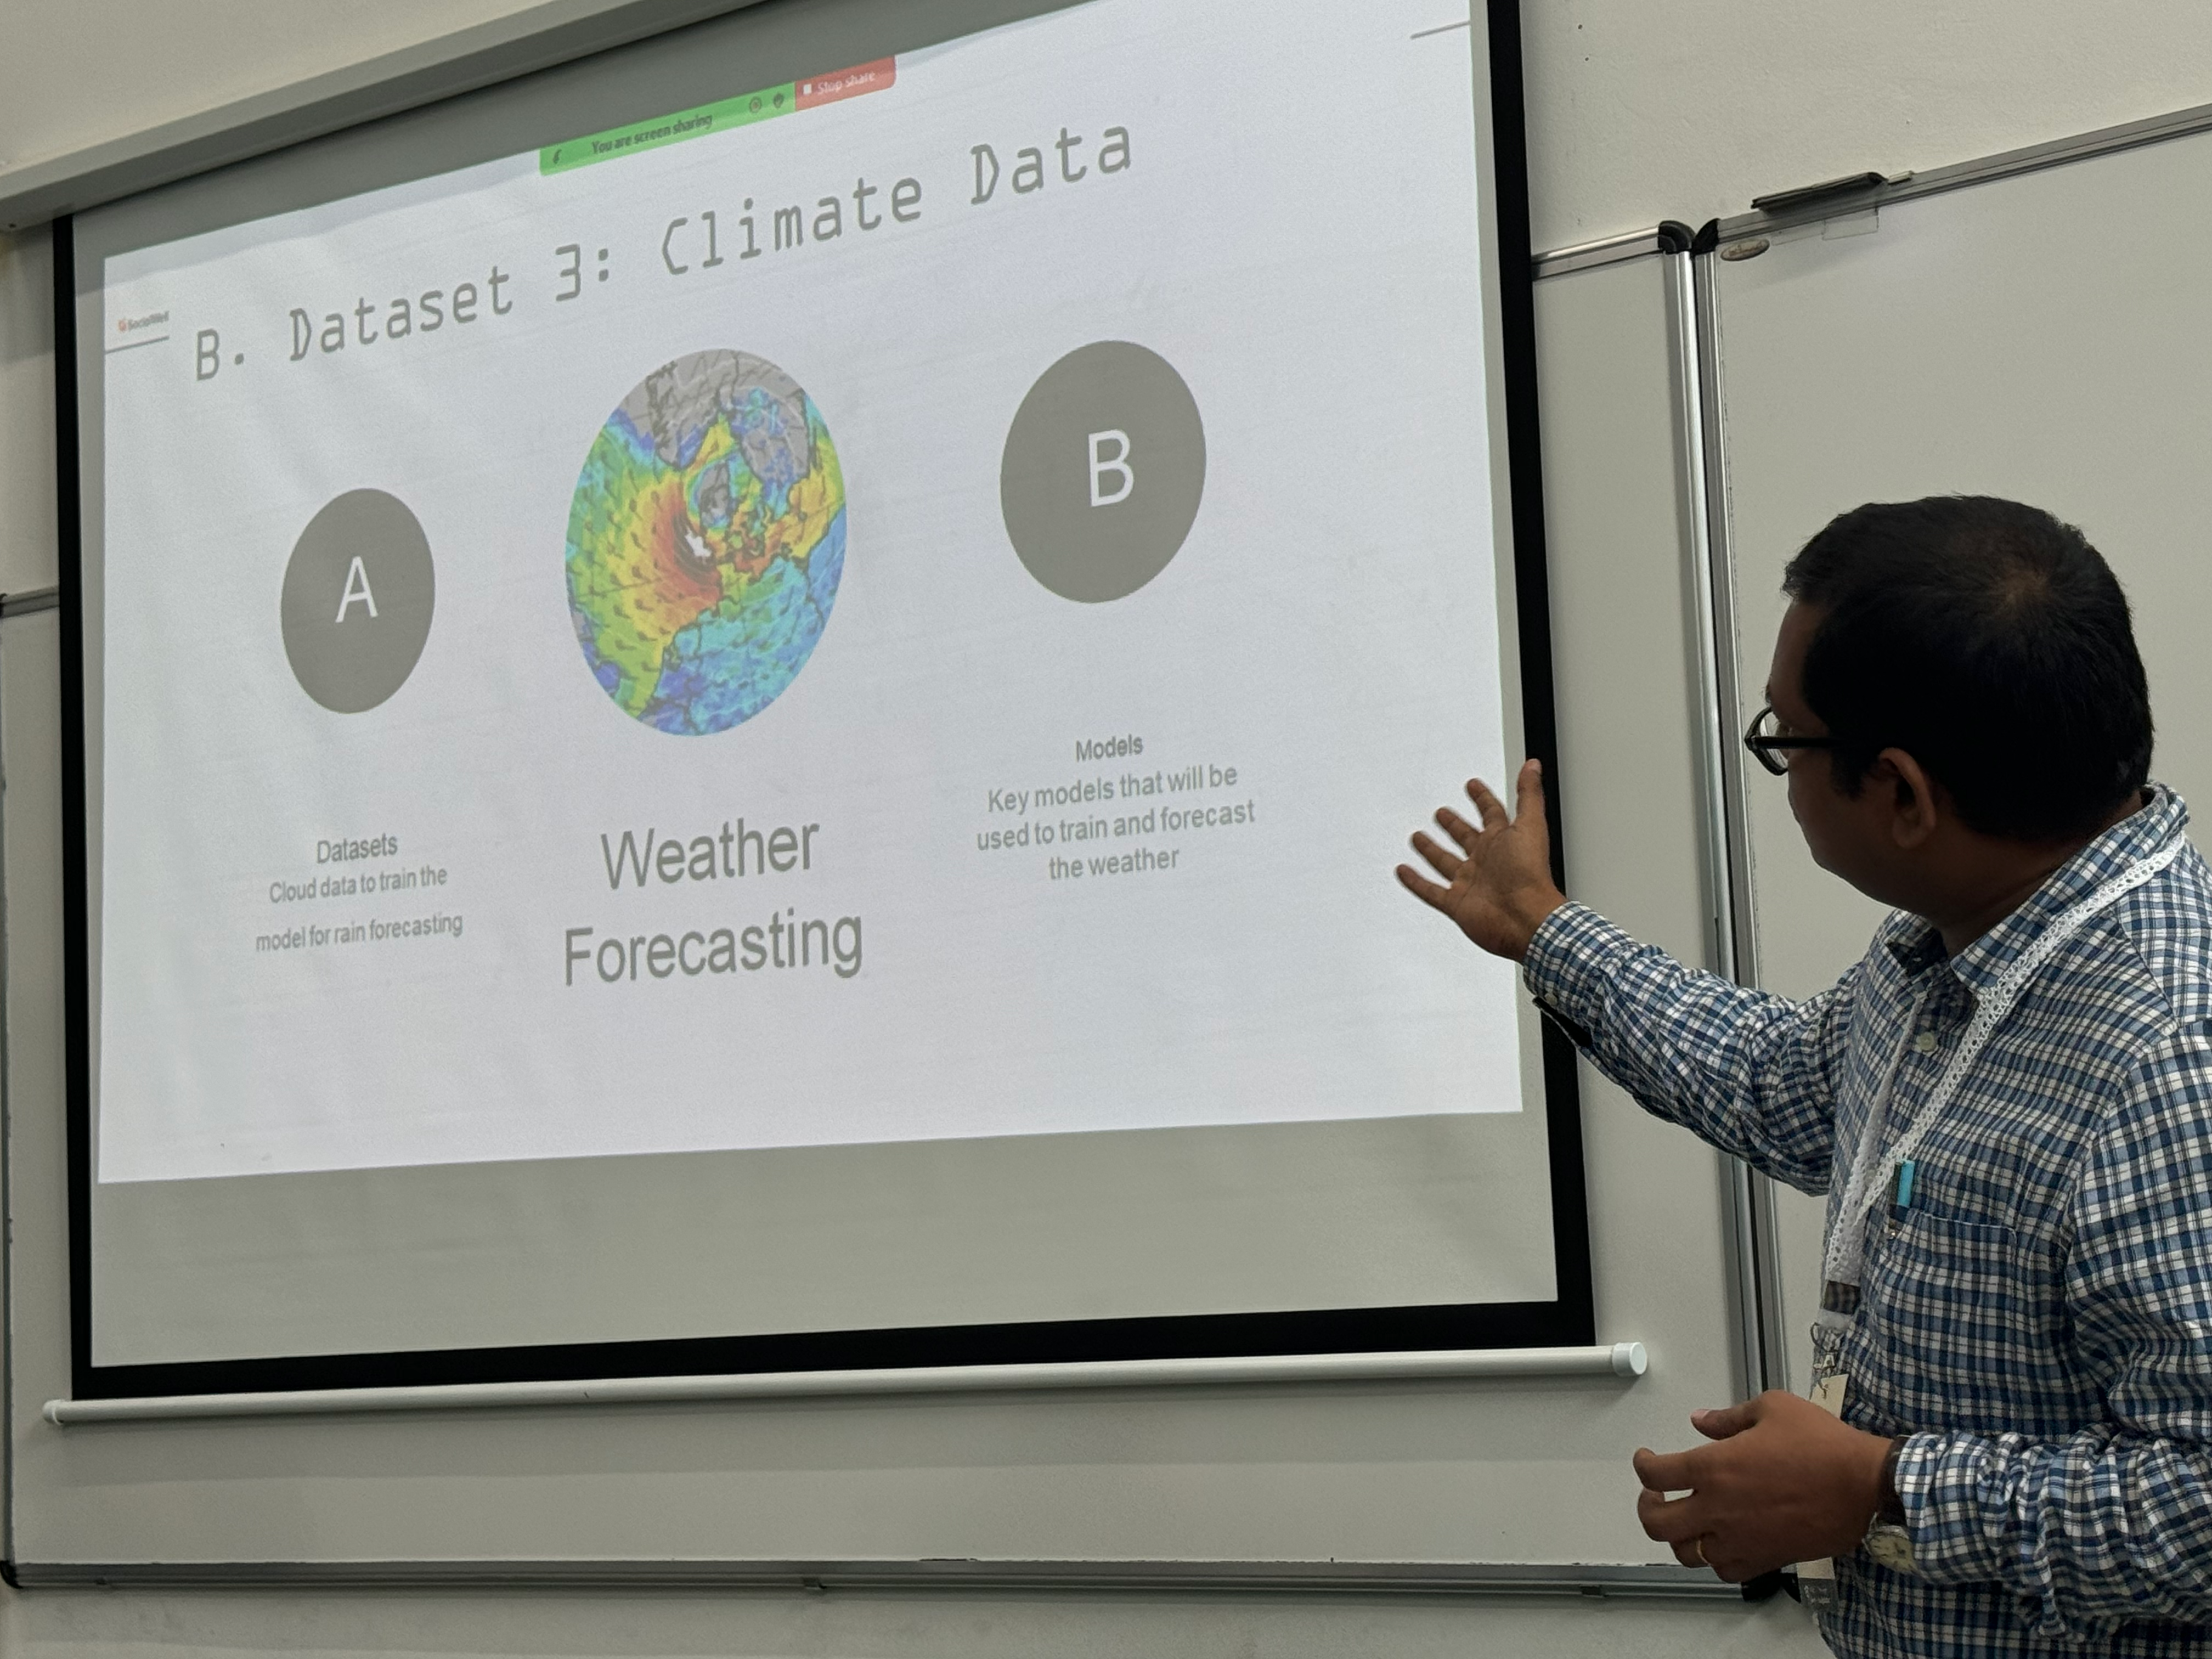
Atanu switched tack to the business side of things, focused on switching Farmer Producer Organisations (FPOs), of which there are 10000+ in India, to adopt climate-smart practices. The incentive based approach includes:
- Business Plan: Farmers, FPOs, and market data collaboratively generate a business plan, which is then used by FPOs to secure loans.
- Land Parcels and FPO Rating: Farm inputs, soil, and weather data are tracked to classify and rate each land parcel.
- Climate Smart Financing: Execute the plan based on the gathered data.
The key requirements for obtaining an FPO Land Parcel Rating with their method are:
- Farm Inputs: Data on seeds, fertilizers, and pesticides provided by the FPO and sourced by the farmer, recorded by the FPO.
- Soil Data: Rating of soil using a combination of mobile and sensor technologies.
- Climate Data: Sourced from public datasets, focusing on classifying rainfall and extreme weather events.
- Farm Practices: Documentation through photos of sowing, irrigation, and data on the methods used.
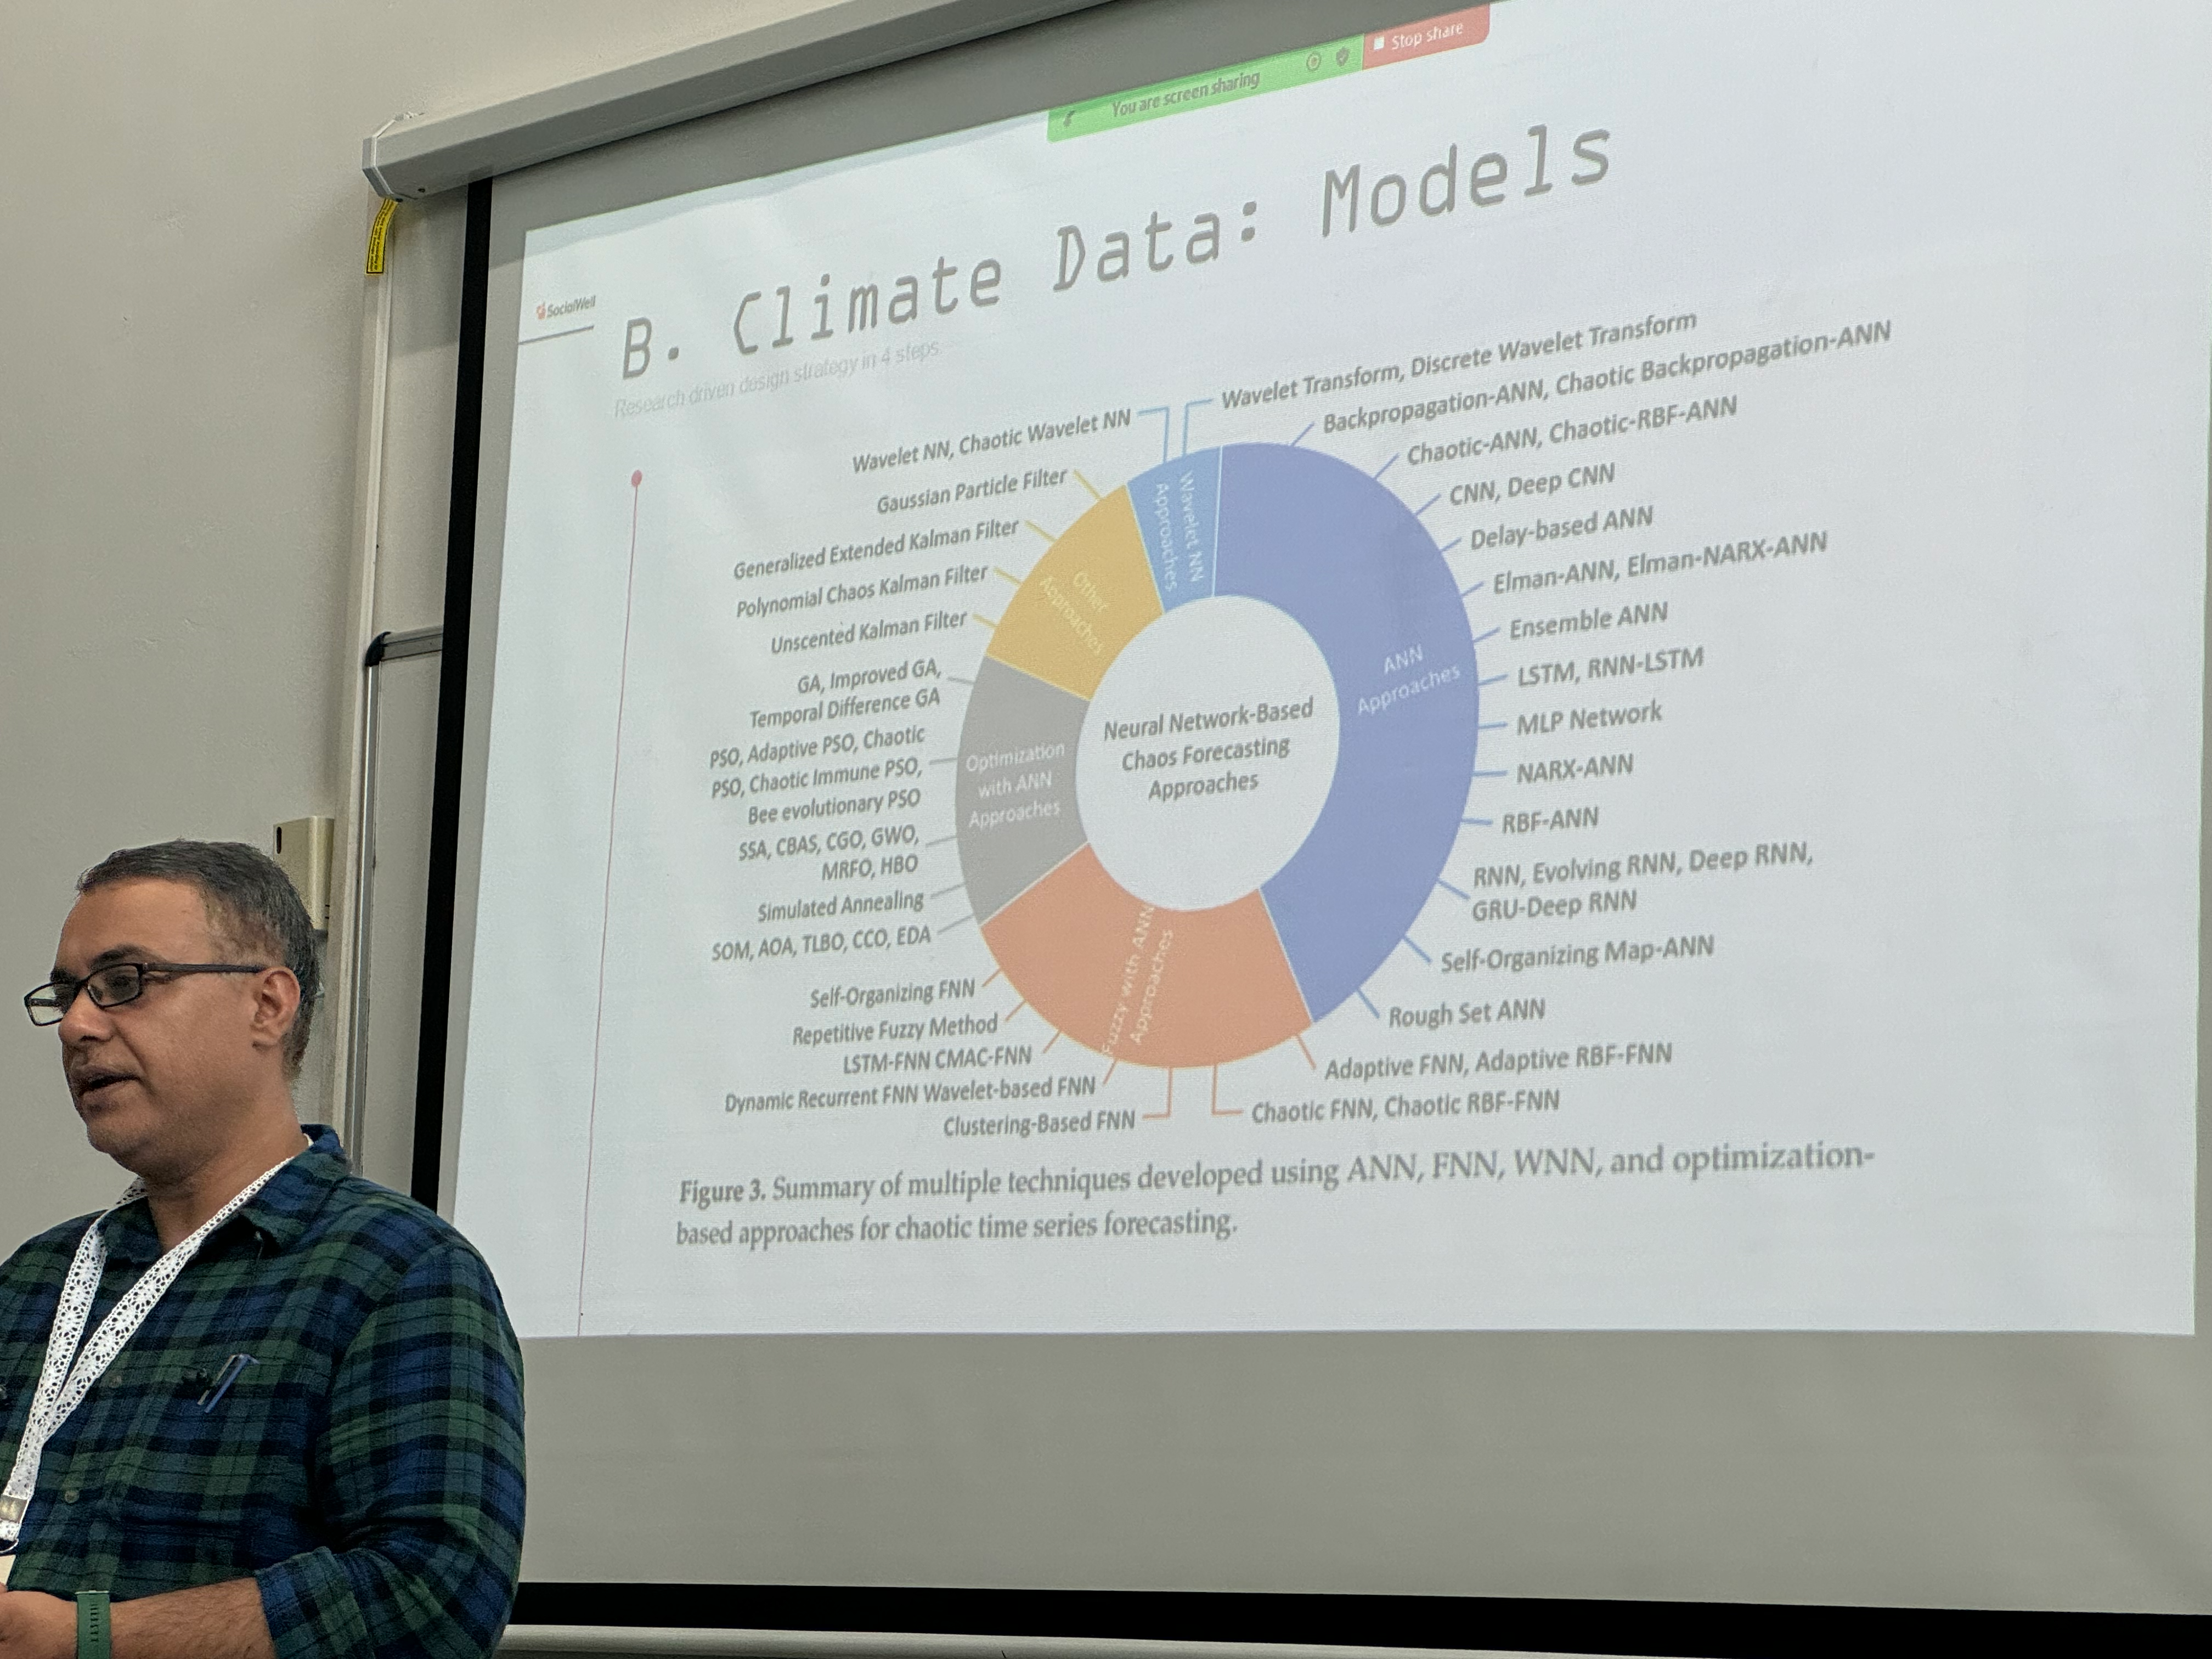
For climate data, their approach involves using neural network-based chaos forecasting to provide weather predictions in a format useful to farmers. The second half of the presentation went into great detail into their ensemble methods to predict weather patterns, which I didn't note in detail, but see
Session 3
Groundwater monitoring tool, challenges to apply ecological health monitoring at scale - Himani Sharma/Chiranjit Guha
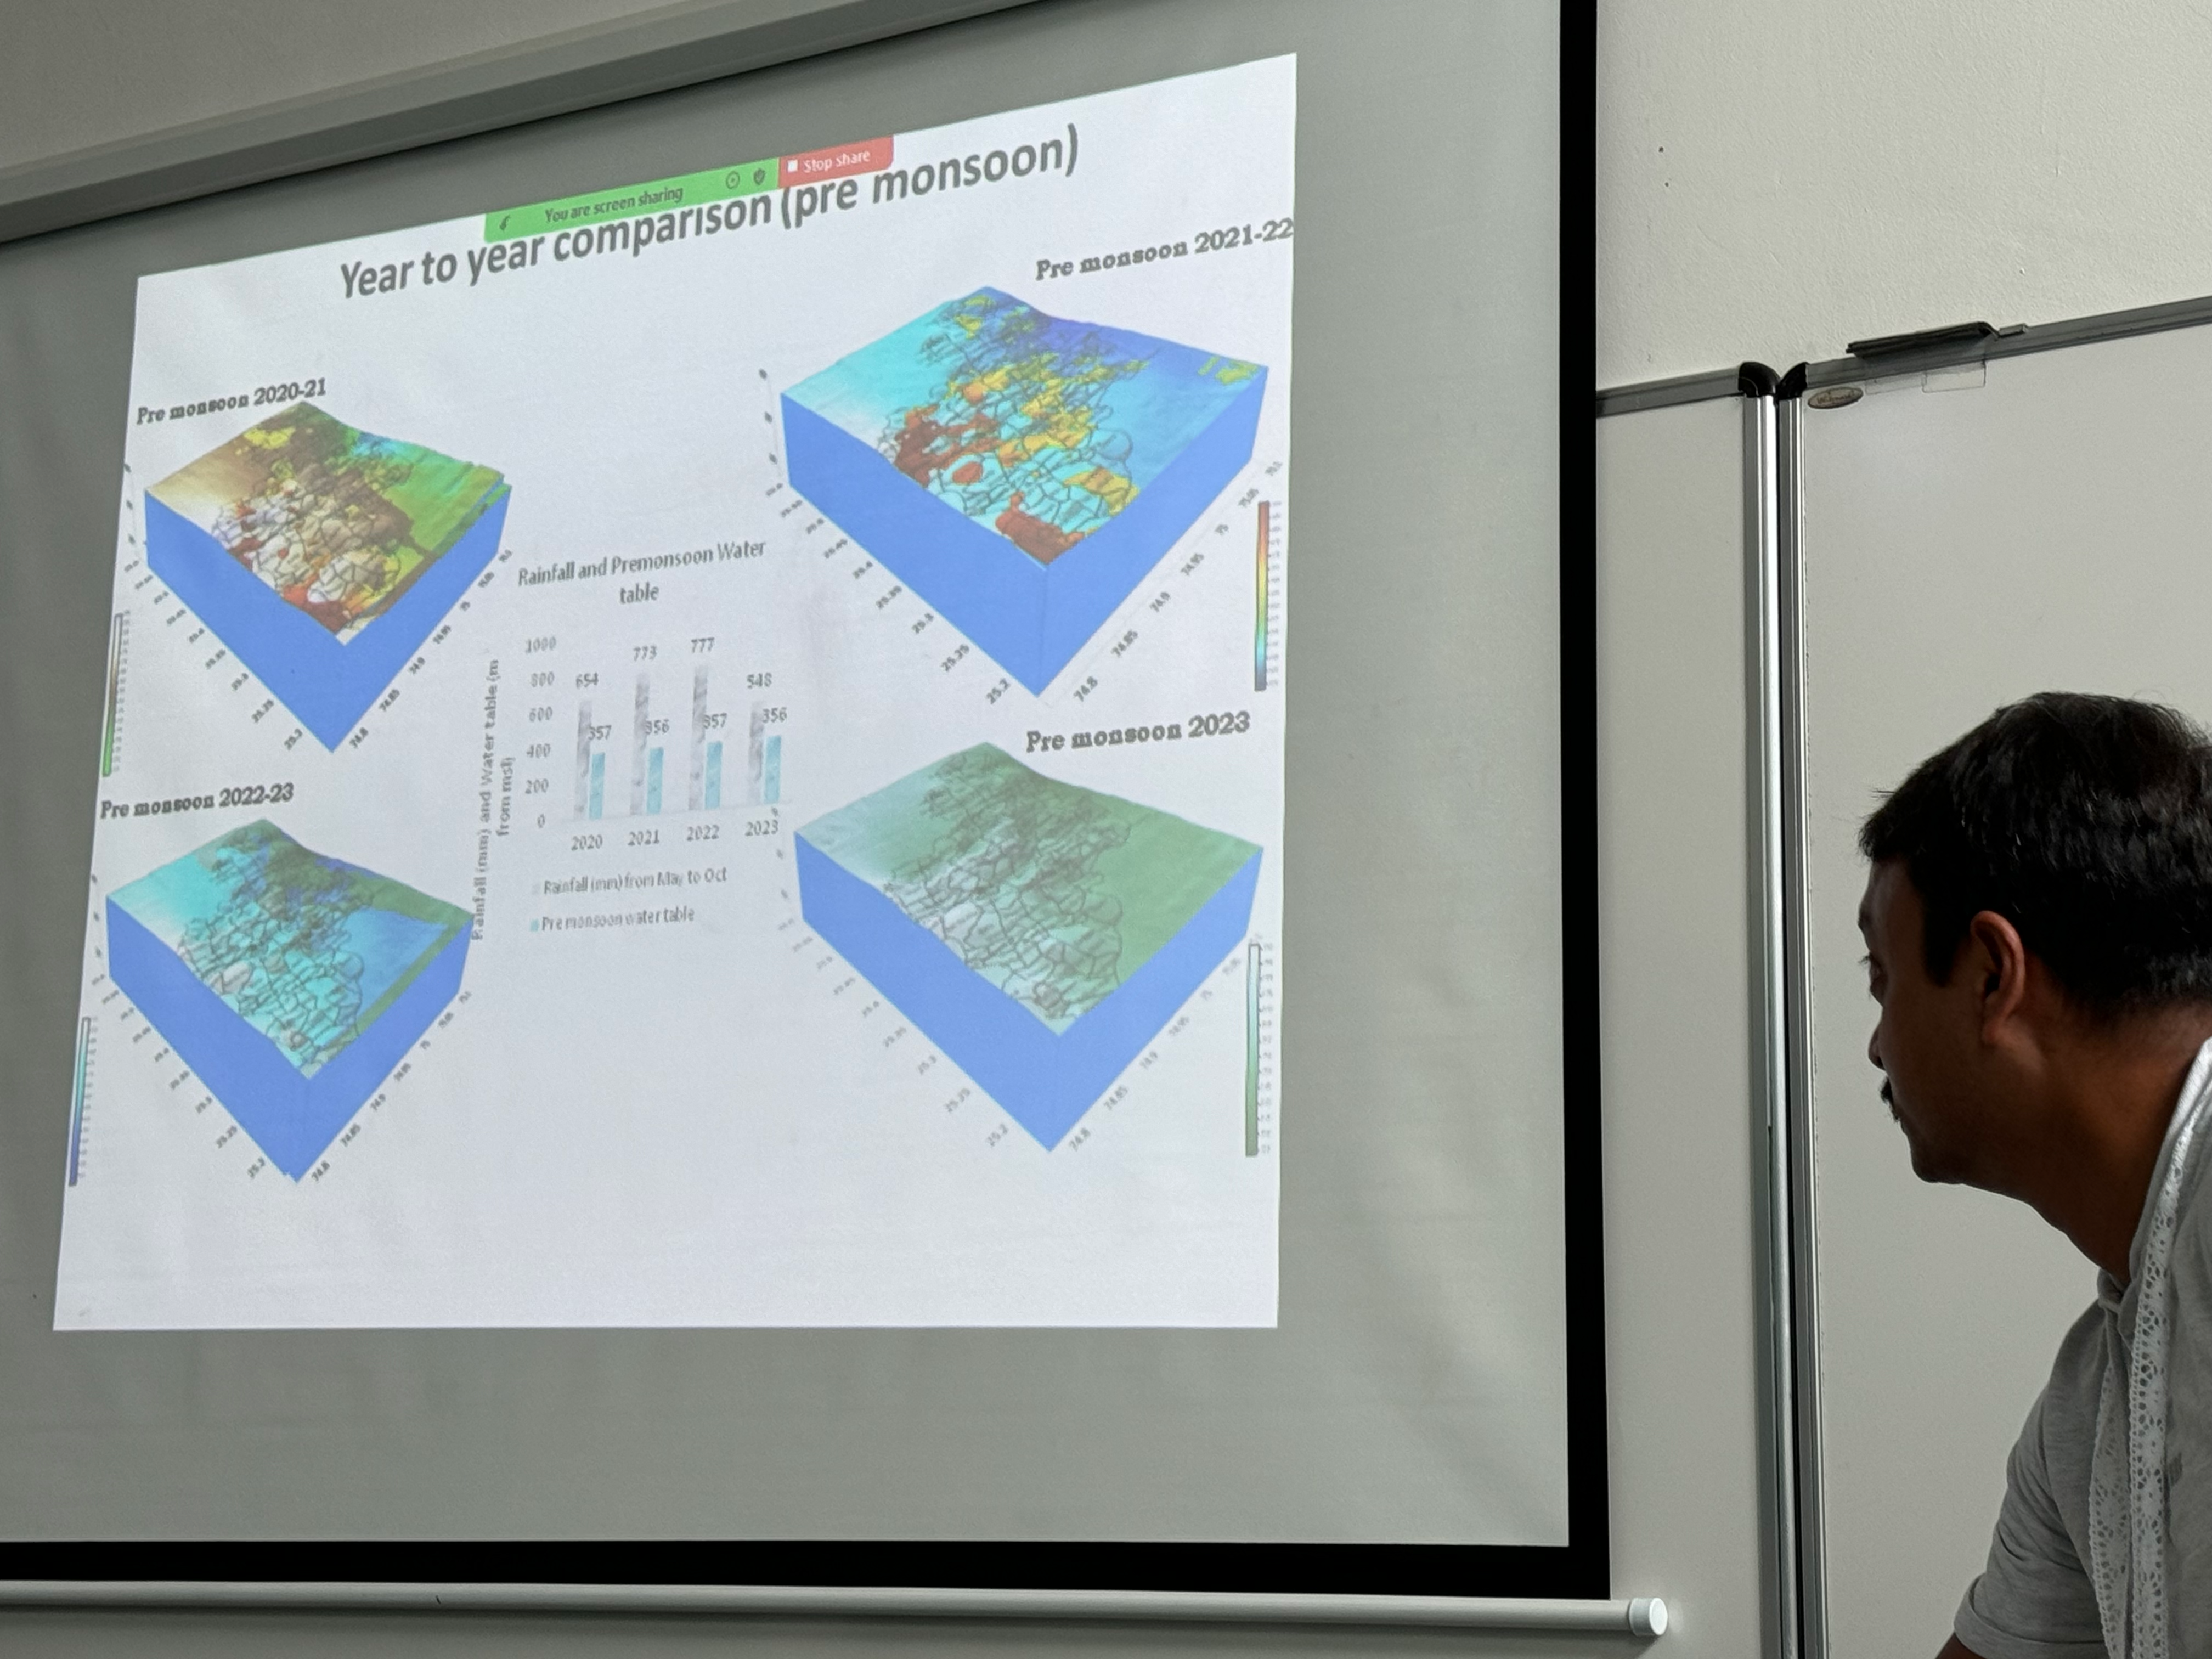
The app enables users to generate village-level groundwater maps, correlating water level data with geological information to create comprehensive groundwater flow maps, even within individual villages. The process involves measuring water depth from three wells per village, using GPS and mobile devices, and rendering the data on an online platform.
In addition to groundwater monitoring, efforts are also focused on community-based ecological health monitoring, including biodiversity, biomass assessment, and pollinator/insect tracking. Four sample watersheds with detailed socio-ecological-economic indicators and over 150 annual monitoring sites are used to track changes in vegetation and species over time. These assessments both reveal valuable insights (e.g., the increased presence of a rare frog in specific watersheds) and are resource-intensive and challenging to scale. Potential solutions include GIS-based platforms, remote sensing, and tools for tracking changes in standing biomass, carbon stock, and biodiversity.
Note to self: Possible connection with the iRecord team in the UK to explore applicability of biodiversity data collected?
The project also maps highly infested areas by invasive species, such as the Lantana camara, to focus restoration efforts abd is drawing on data from 150+ sites.
Q: what are the next steps? A: going to withdraw the Android app in the next few years, so the government is taking over next after creating a similar app. Declaring the project a success! Q: But will the data remain open for the communities once the government takes over? A: There is a growing widening of the dataset collection (e.g. biodiversity) to refine the datasets for things not yet considered such as ecosystem services. Not clear on the future of the government-run data provenance.
Land Suitability Assessment -- Athithiyan MR
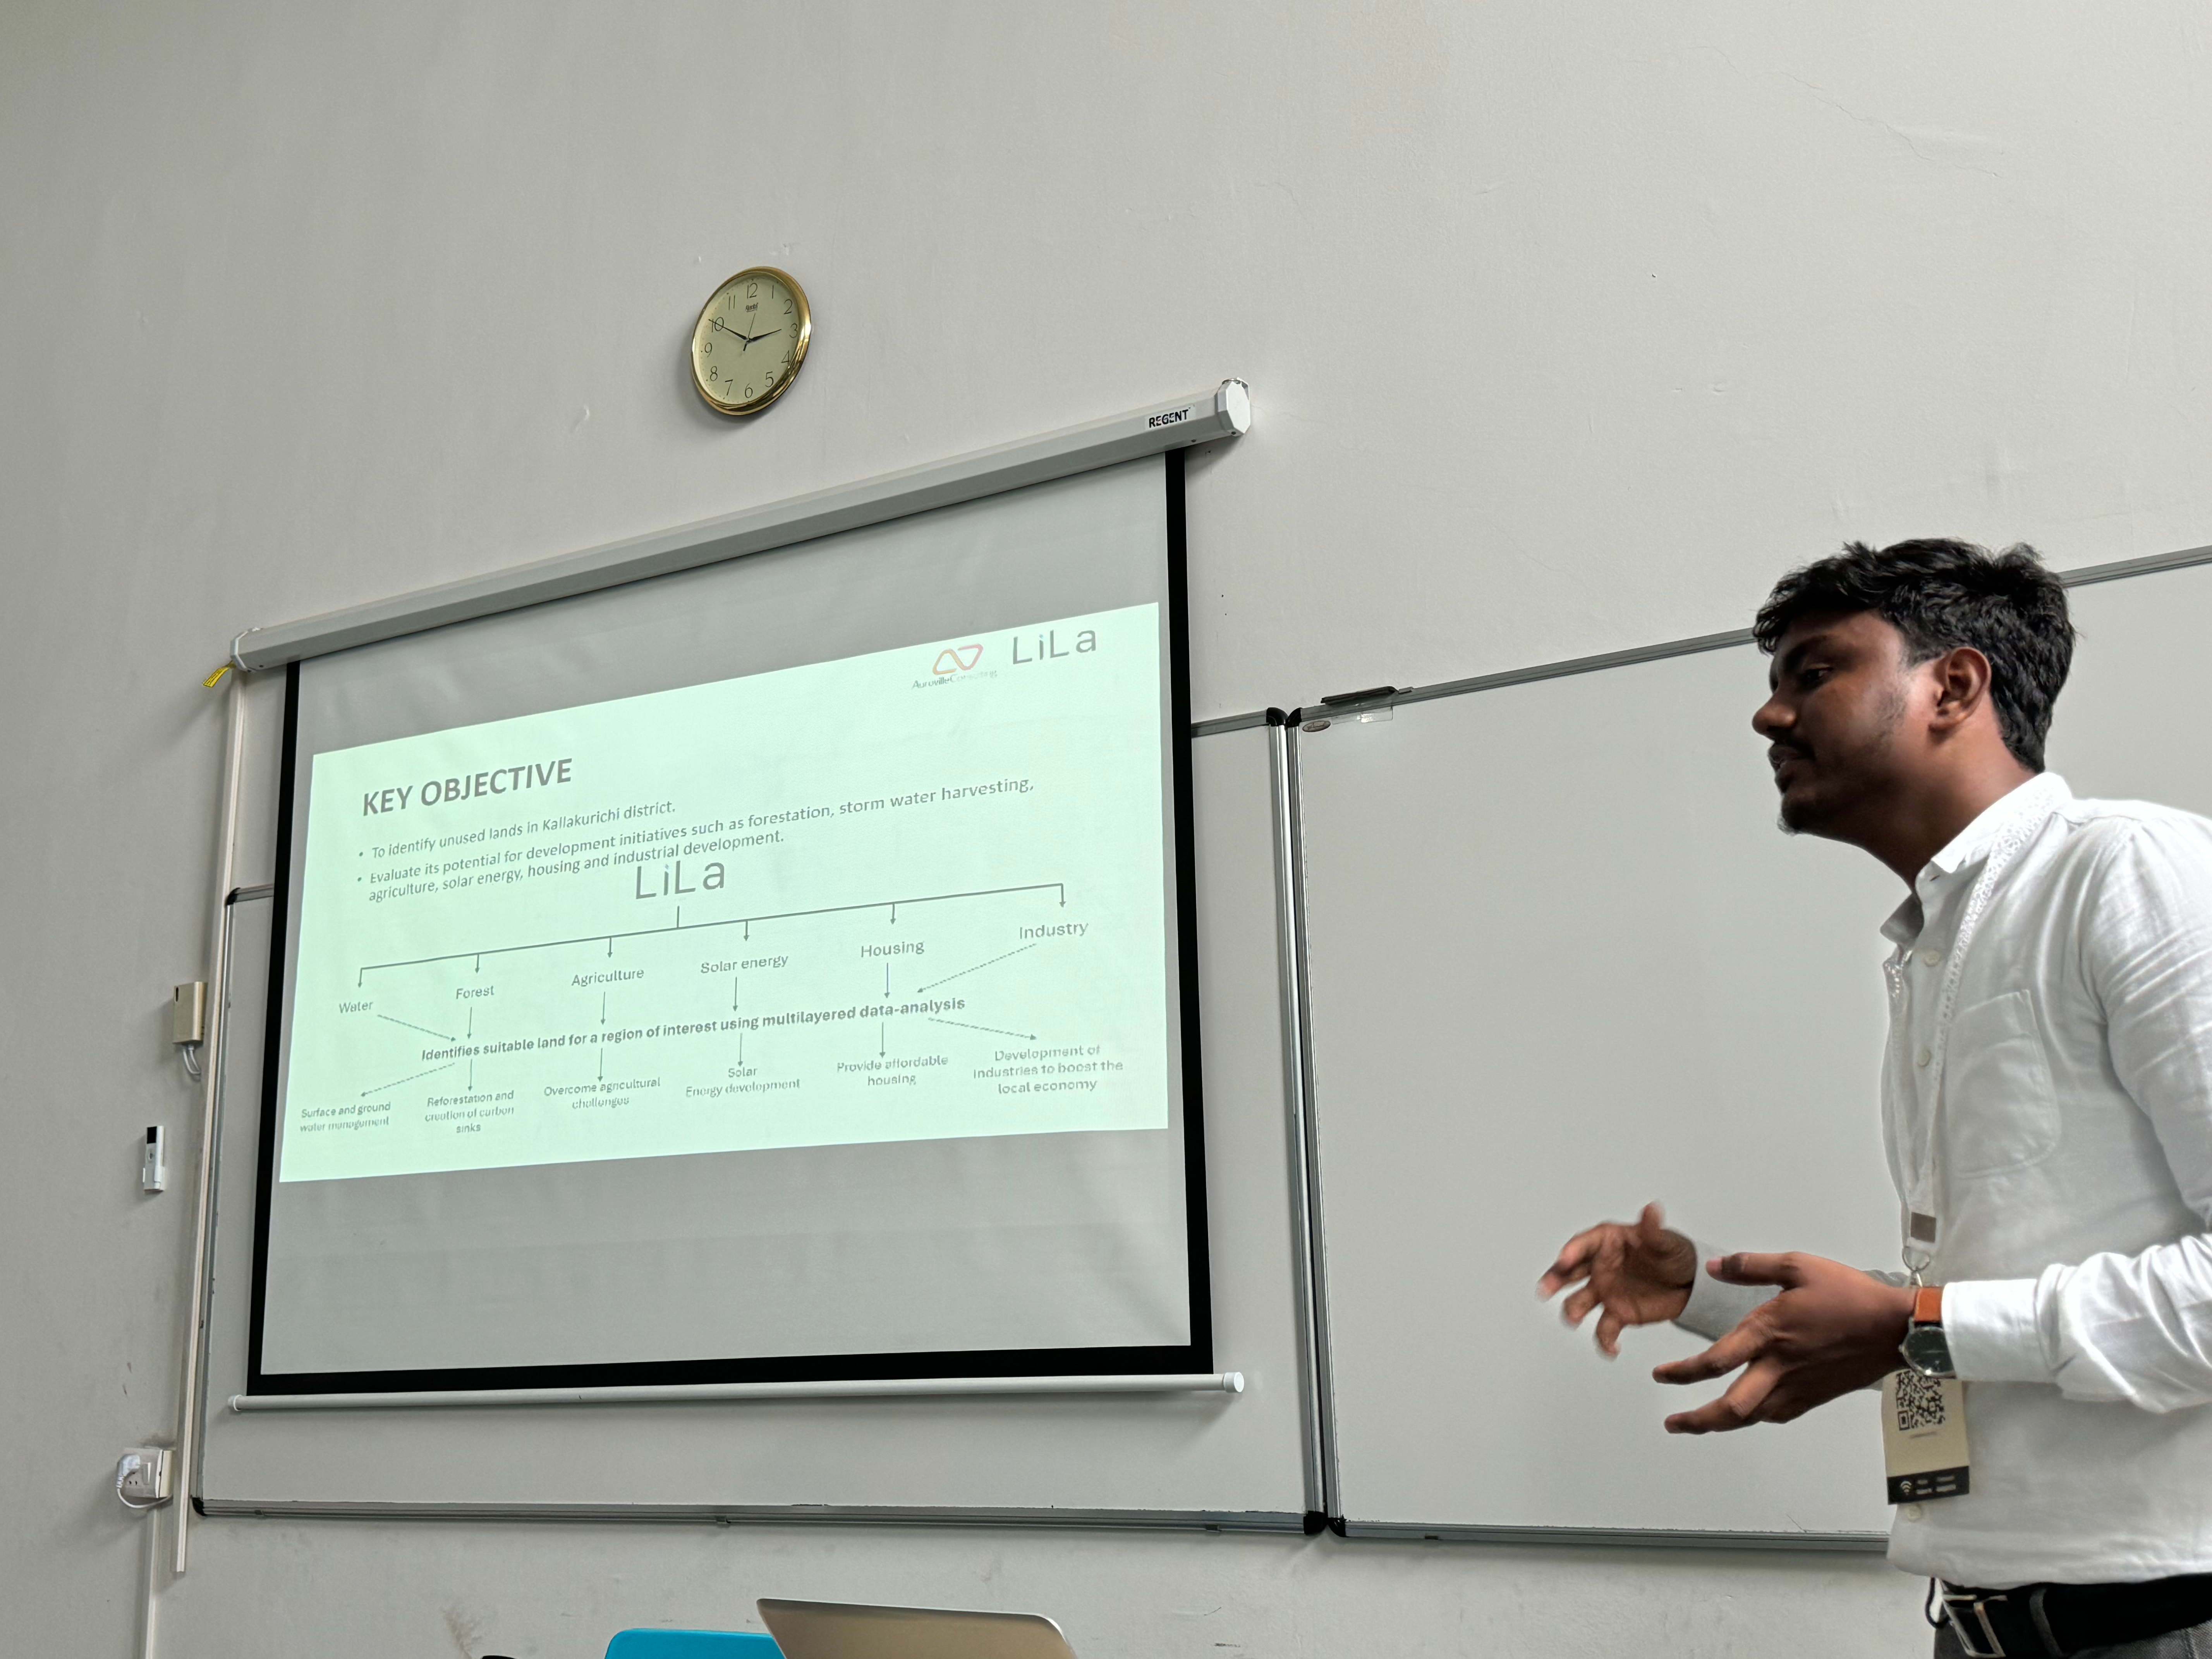
The system integrates geospatial and socioeconomic data layers, along with public datasets, to produce an interactive map and report, determining whether land is unused and suitable for intervention. Data collection is facilitated through a mobile app that traces land boundaries using GPS, captures four site photos and a video, and gathers information on land ownership and existing vegetation (shrubs and trees).
Designing for Context - Aila Dutt
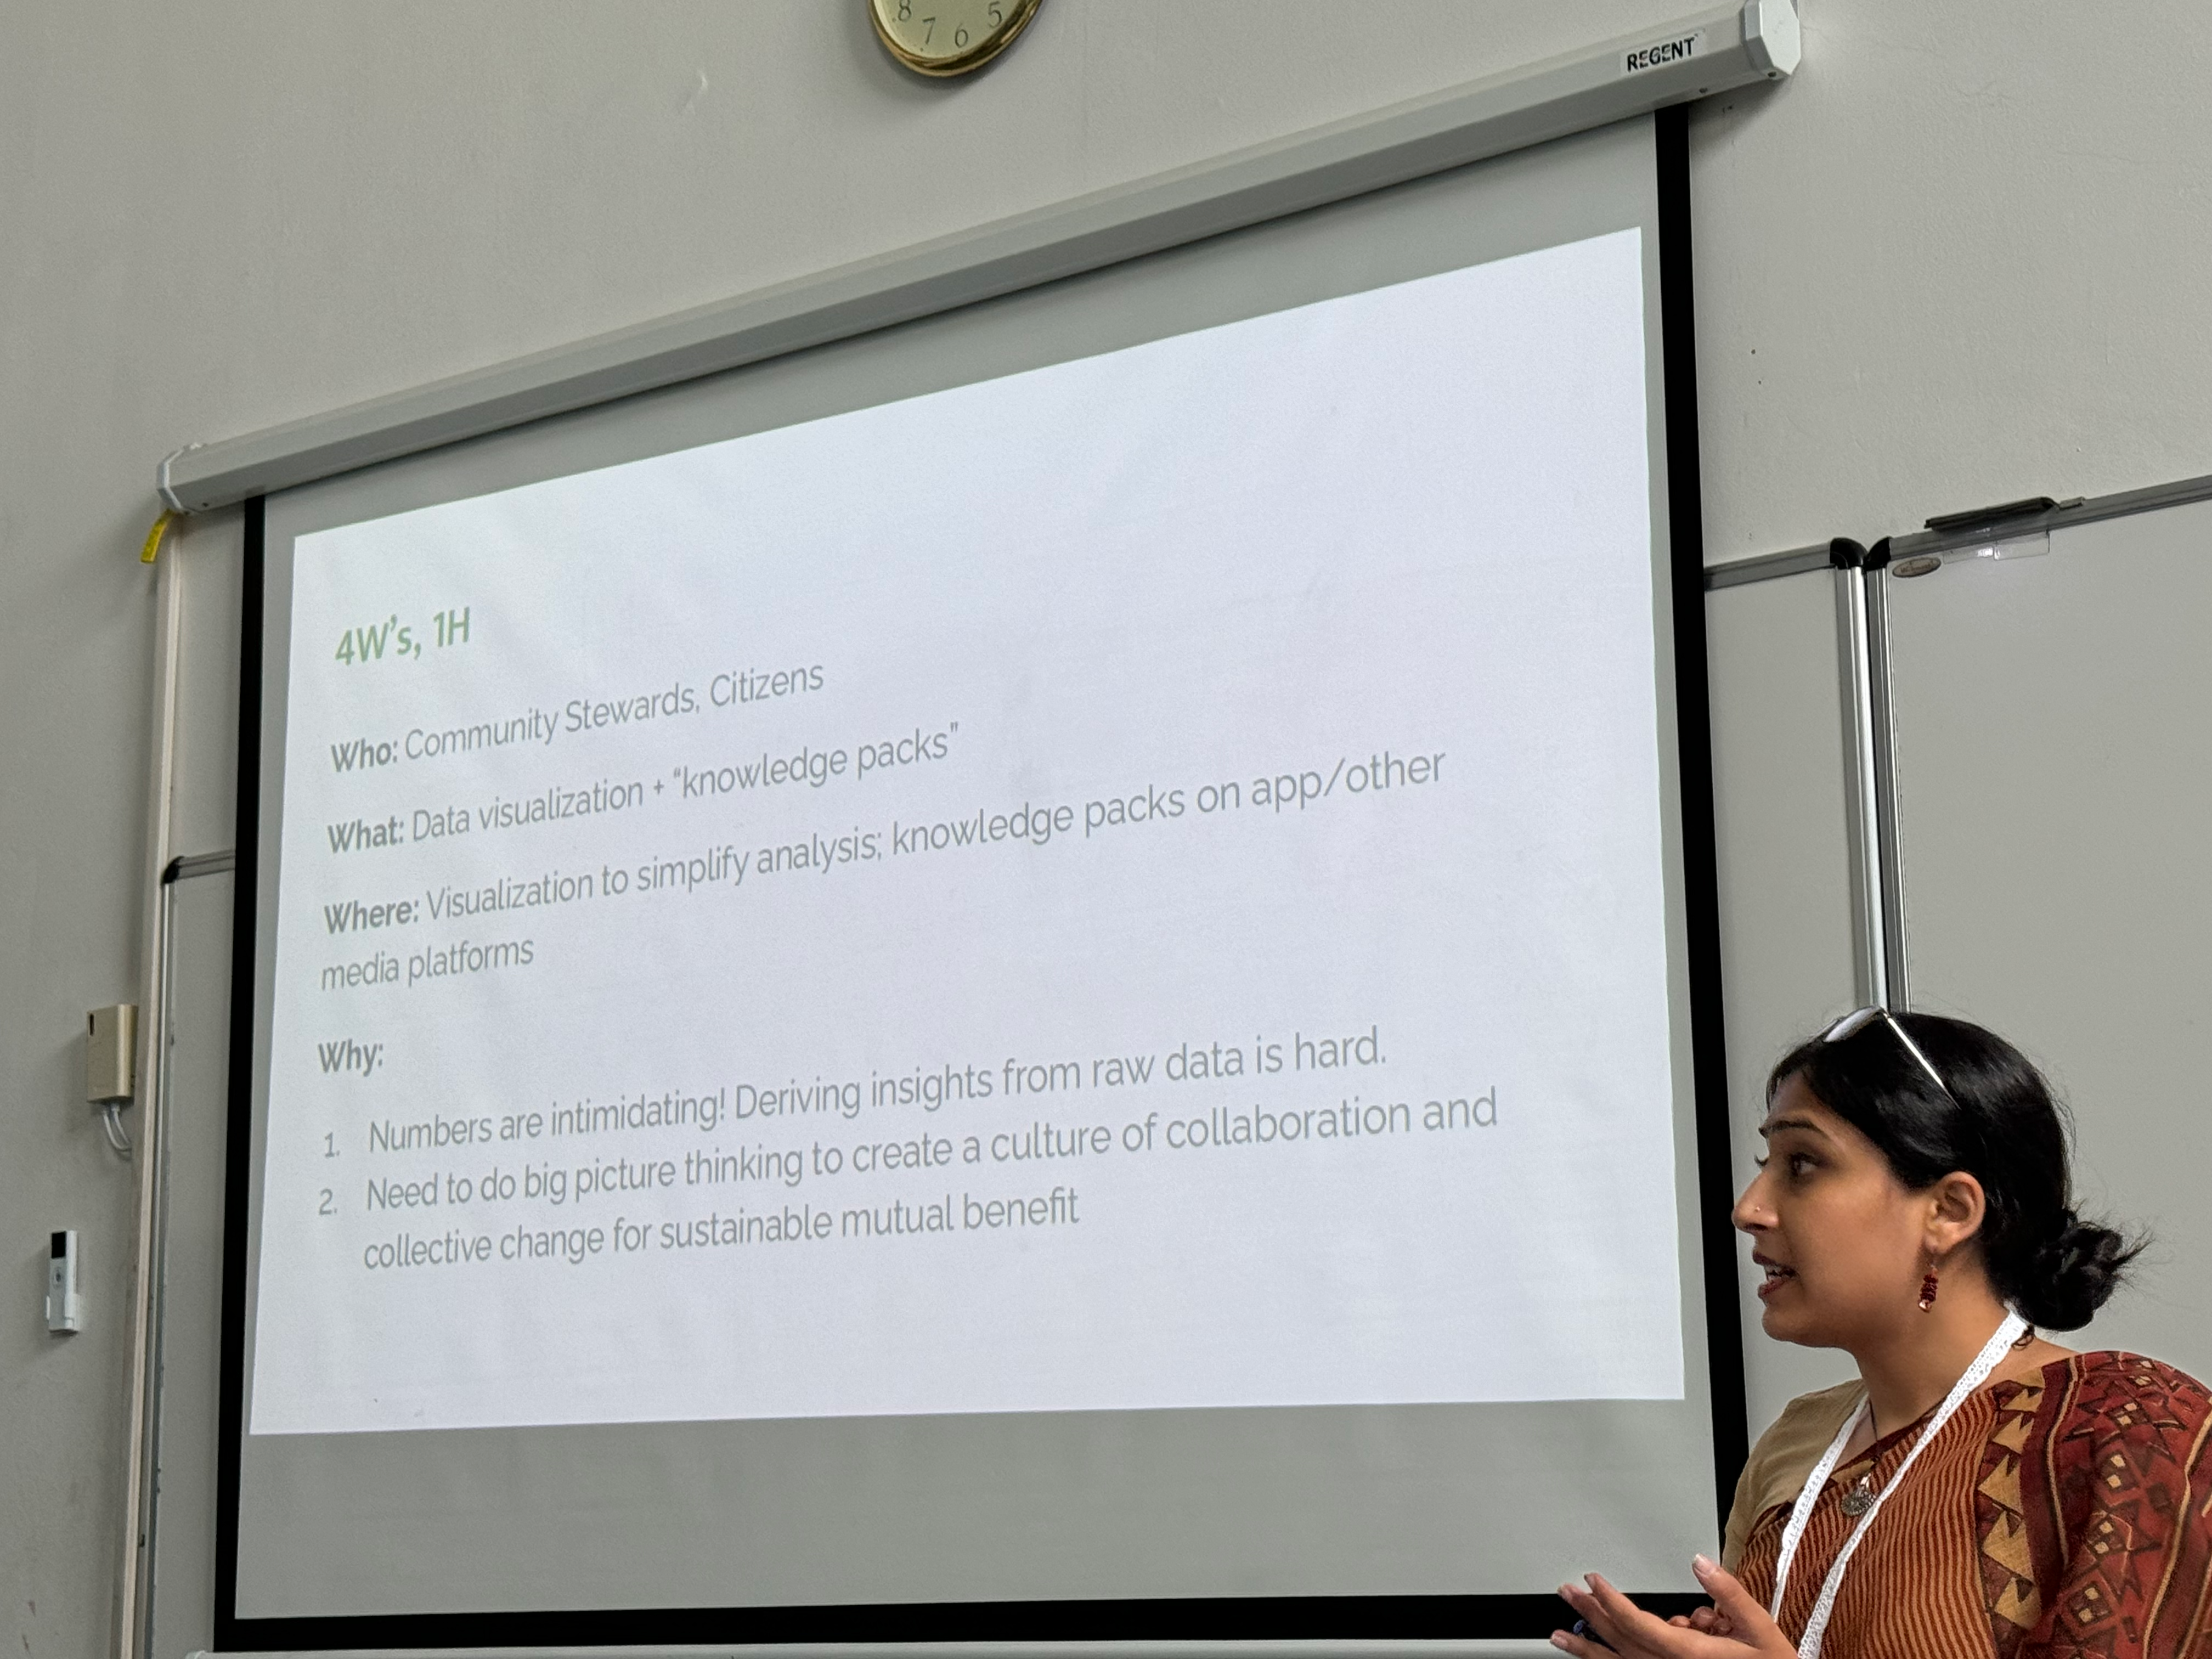
Broad research approach:
- Discover: Conduct field research, interviews, observations, secondary research, and expert consultations.
- Define: Engage in systems mapping, curriculum design, and persona mapping using analogous examples.
- Ideate: Perform field testing, map problems to solutions, and explore sacrificial concepts.
- Prototype: Conduct usability testing, create sketches and wireframes, and integrate data analytics.
To enhance understanding, environmental education and curriculum design can incorporate semi-fictional "case studies" that place users in relatable contexts. This approach increases adoption by breaking the system into modules and using gamification to test concepts. For example, users can explore the concept of 'climate change' as it pertains to their own land and prosperity.
In the analysis phase, it’s crucial to not only graph data but also describe it in ways that participants can relate to their own landscapes. The decision-making process must integrate data-driven insights with existing frameworks. Generative images and brainstorming sessions are used to develop innovative ways to visualise complex data, such as precipitation and climatic variables, in a simple and understandable form.
Example Activity: "Set a 15-minute timer and brainstorm all possible ways to present data simply." Consider descriptors like terrain, slopes, plains, rainfall, surface water, MNREGA projects, and agriculture to see how users can better utilise this information.
Q: Is 'making data actionable' a priority, and how do we address the tragedy of the commons? A: Yes, systems thinking and collaboration are essential to prevent resource depletion and ensure shared benefits. Q: Can this approach scale from smaller to larger communities? A: Yes, by developing microwatershed data and village-level datasets, even large communities can work at much smaller, more precise resolutions.
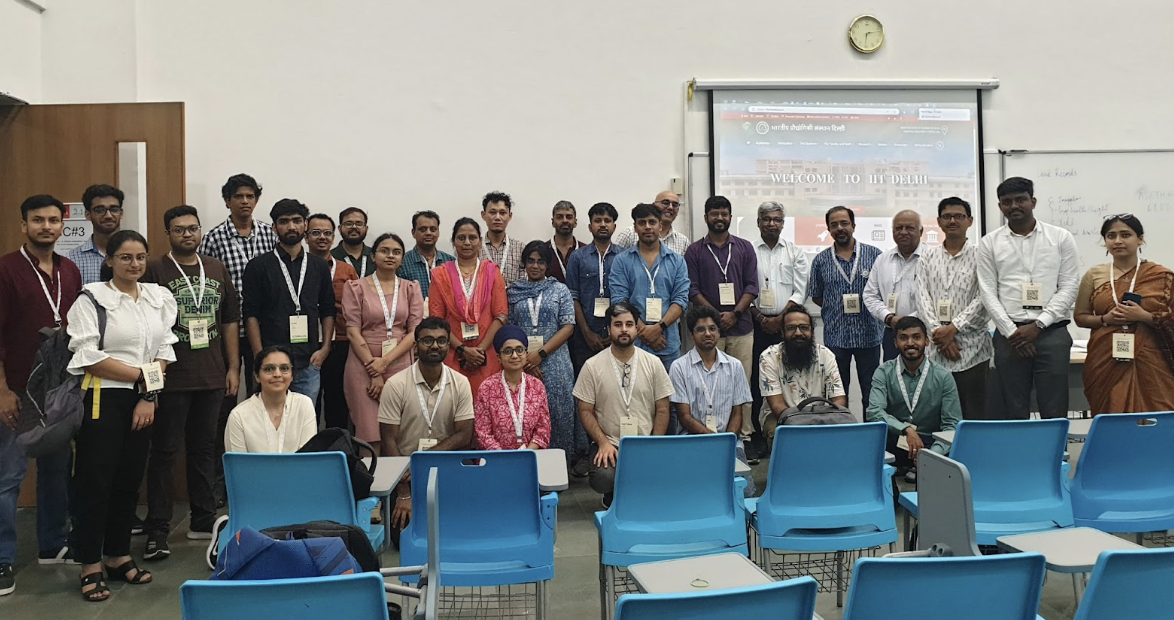
Group Sessions
After this, we split into groups to discuss the following topics roughly as follows:
- What do we need to do to take this into scale? e.g. remote sensing: works at some scale, but validation also needs to scale.
- Then we saw new usecases. E.g. soil moisture. Now we need to think this through and come up with succinct problem statement to.
- Start taking through some datasets and algorithms as examples and turn them in to a spec. What is the specification process and ultimate metadata standards?
- One group then will work on methods to facilitate community engagement with data
- And then what are principles and processes for effective collaboration and co-creation. What are barriers?
I'll follow up with more analysis about the outcomes soon, as I'm in touch with Aadi and hopefully we will be working on a project together in the future. But for now, I'll conclude this trip report with great appreciation for Aadi and the hard working volunteers at COMPASS 2024 that made attendance such a pleasure!

References
- Zuñiga-Gonzalez et al (2024). Green Urban Equity: Analyzing the 3-30-300 Rule in UK Cities and Its Socioeconomic Implications. 10.5194/egusphere-egu24-20833