
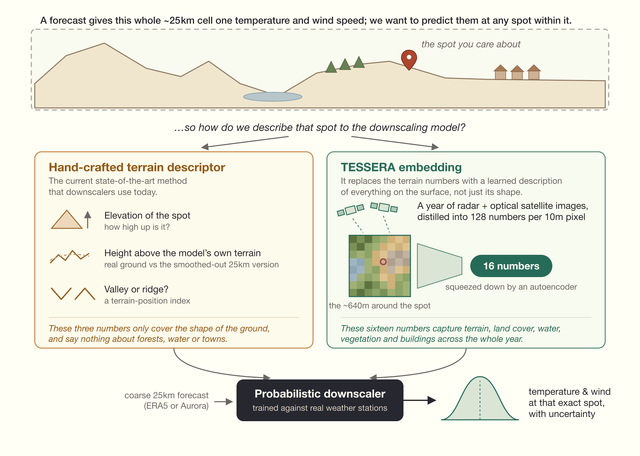
Pedro Sousa has put his first preprint paper online, on the topic of improving weather prediction using satellite foundation models! "Earth observation embeddings are effective sub-grid descriptors for probabilistic weather downscaling" (also on arXiv) was joint work with Sadiq Jaffer, Robin Young, Will Tebbutt and Rich Turner with much help from the wider Tessera team.
Since the paper is quite machine learning heavy I wrote up a splainer here. I had to get rapidly up to speed on how weather forecasting works when we started working on this at the start of the year!
1 How weather downscaling works today
Weather forecasts and the "reanalysis" datasets that reconstruct the past atmosphere (such as ERA5), are usually plotted on grids of ~25km. Each grid cell tracks the temperature, wind, precipitation, etc within it, but on a patch bigger than (e.g.) Cambridge and its surrounding villages.
This big area often sees wide variance within it. For example, an urban heat island can be 1–3°C hotter than agricultural fields around it, and on calm clear nights a valley floor could be 4–8°C colder than a slope a little higher up. Wind also accelerates as it funnels through gaps in terrain, but slows over forest canopy and buildings. It's important to be able to do finer-grained forecasting to account for these variations; we're all finding that the difference between +-4C is huge this summer.
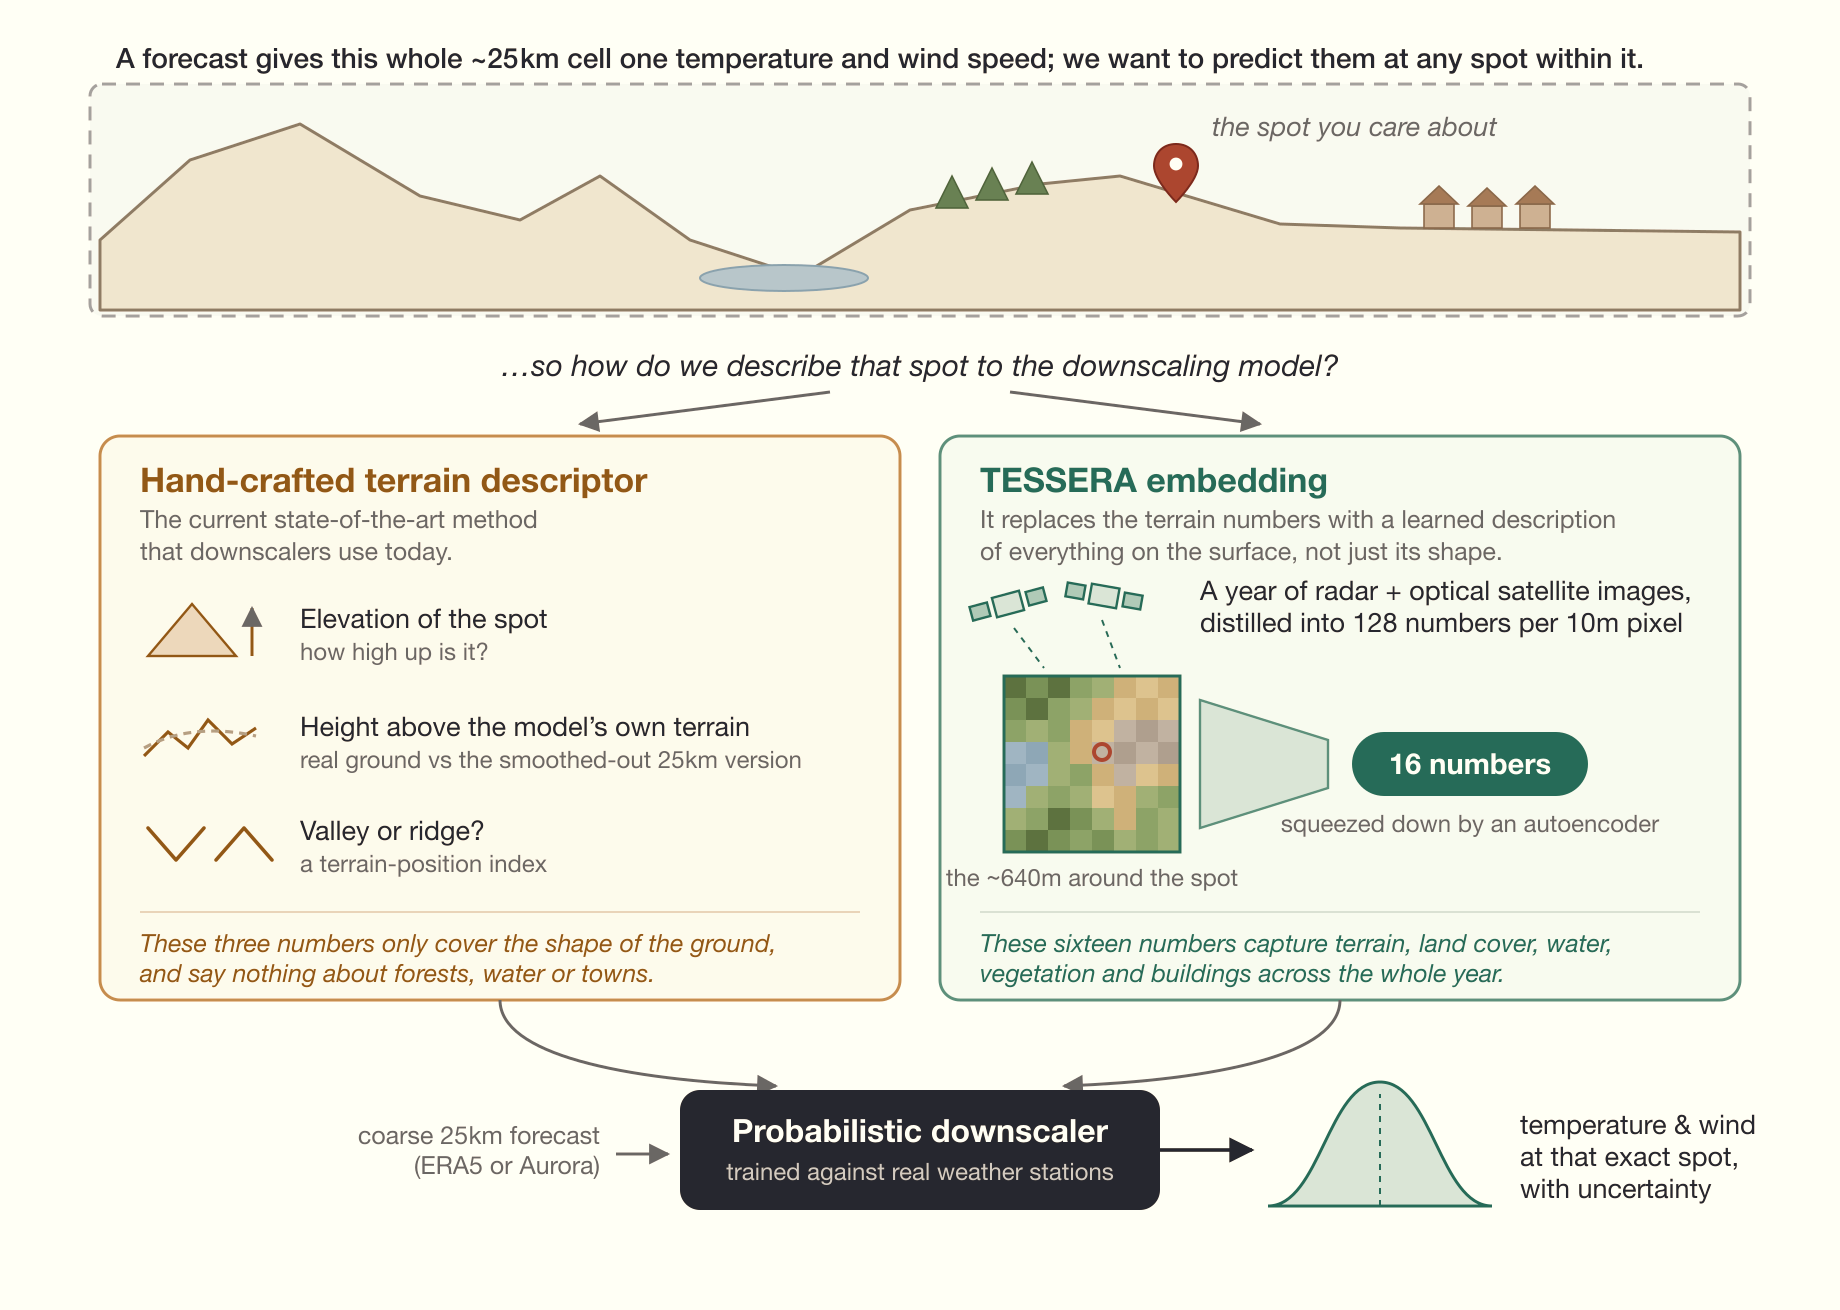
The standard way to "downscale" weather forecasts from large grids to smaller areas is to train a statistical model against real weather station observations, and use it to predict the value at a finer point. This requires the 25km coarse grid and also some facts about the specific off-grid point. The SOTA for doing this probabilistically at any coordinate is the technique used in Aardvark. Each location is assigned a hand-crafted terrain descriptor containing the elevation, how much that elevation differs from the model's smoothed-out terrain, and an index saying whether it's a valley or a ridge (i.e. the shape of the ground).
2 Replacing hand-crafted descriptors with TESSERA
However, terrain is only one reason why a prediction in a particular spot might depart from its 25km cell average. Land cover, forest, water, soil, and (especially) an urban built environment all matter too! So, we tried replacing the handcrafted features with a rich representation that has already learned to describe the planet's entire land surface. Our TESSERA foundation model has been pretrained on millions of optical and radar satellite images and supplies a 128-dimensional embedding for every 10m pixel on Earth.
Since a single 10m Tessera pixel is too small to describe what a weather station observes, we compress a ~640m neighbourhood of them down into 16 dimensions using an autoencoder, and use these to downscale instead of the handcrafted descriptors.
At first glance, it's a little weird that this works at all. Tessera summarises a whole year of surface behaviour, while the weather model predicts instantaneous temperature and wind. However, the ways that a 25km cell might depart from its linear average temperature or wind is actually pretty consistently tied to its persistent properties (e.g. a valley floor pools cold air every calm night, or a forest canopy always drags on the wind). Therefore, an annualised summary of the planet's surface turns out to work very well!
3 Improving both temperature and wind predictions
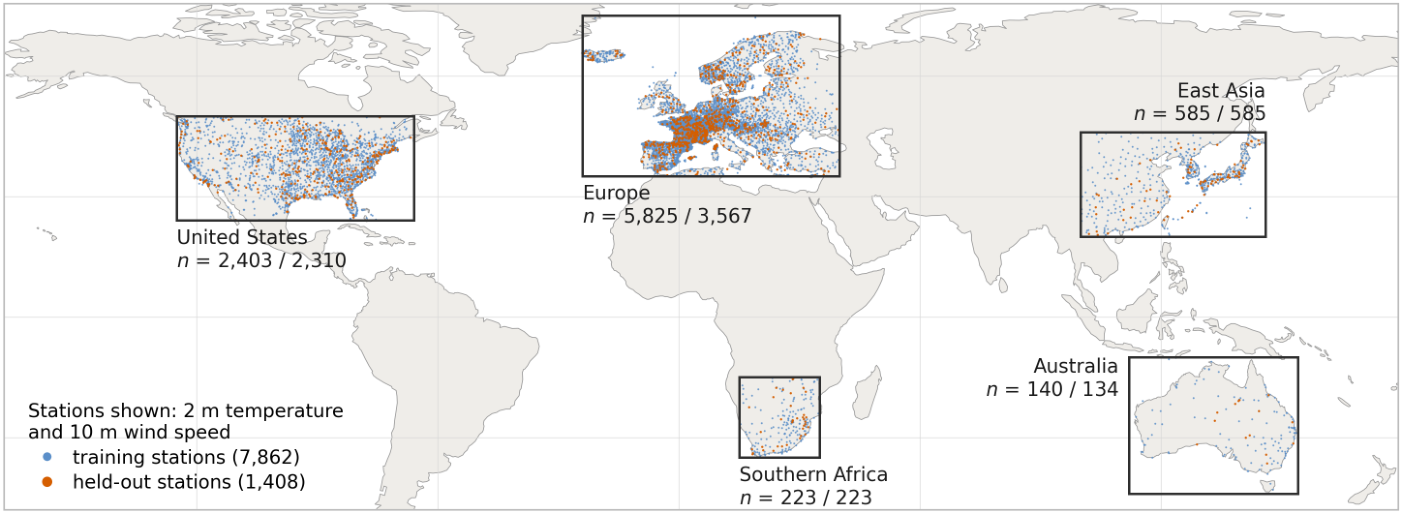
Across five climatically diverse regions spanning over 9,000 stations, adding Tessera improved every metric for temperature and wind at stations (and years) the model had never seen. The probabilistic skill improved by ~11.5% for 2m temperature and ~6.2% for 10m wind speed. Interestingly, temperature and wind predictions benefit differently, though...
3.1 Temperature predictions improve where data is sparse
For temperature, Tessera acts as a transferable prior where stations are scarce. Elevation already explains most of temperature's fine structure (e.g. air cools predictably as you go up). In the very densely observed Europe and USA, the baseline learnt its corrections from topography and the plentiful stations. However, in sparse regions the baseline actually did worse than simply interpolating ERA5.
Adding Tessera reverses that trend in East Asia and Australia, and nearly closes the gap in southern Africa. The fewer stations a region has, the bigger the uplift in predictive capacity with Tessera added into the mix.
3.2 Wind has far more terrain texture with Tessera
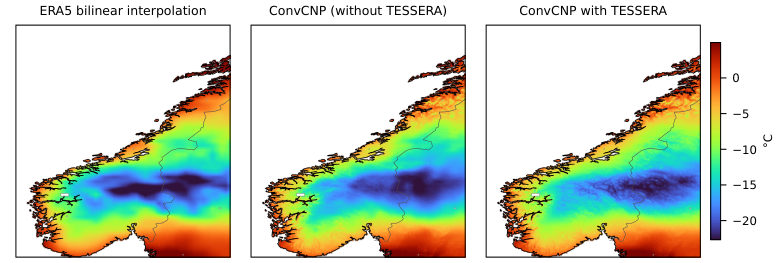
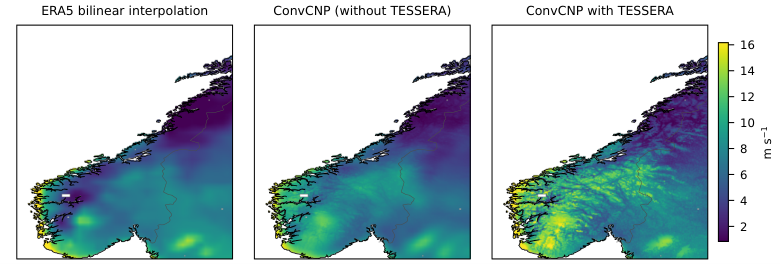
For wind, Tessera supplies information that the handcrafted terrain descriptors just don't have. When rendered as dense maps, the embedding-equipped model resolves 3–4x more fine-scale structure for wind. That extra texture also matches the errors that the baseline makes at real stations. Locations at the same elevation can still differ enormously in exposure, roughness and land cover.
4 Does this hold up for real weather forecasts?
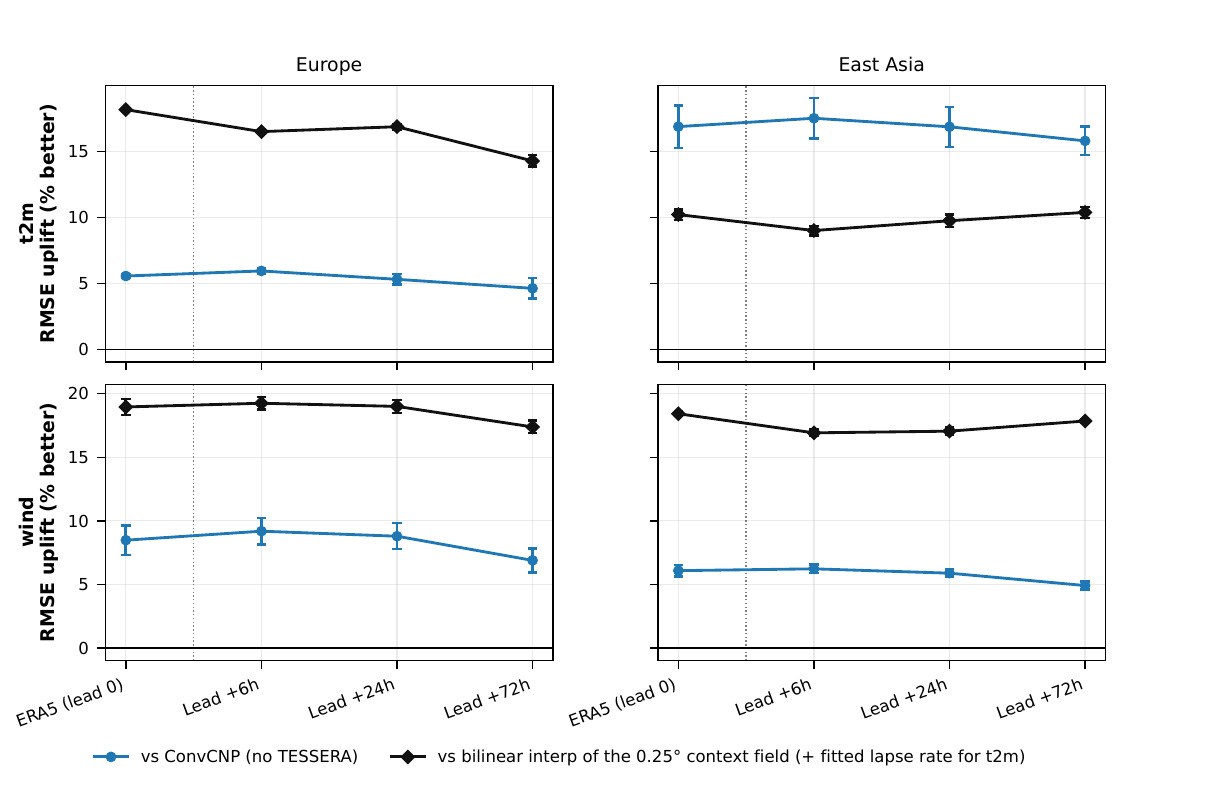
Now, downscaling reanalysis is a somewhat academic exercise as what we actually need to downscale is an actual weather forecast. We therefore swapped the ERA5 input for predictions from Microsoft's Aurora AI weather model.
The TESSERA advantage persists out to 72 hours ahead, as the below graphs show! It's pretty cool that one foundation model (Aurora) supplies the atmospheric model, while another (Tessera) supplies the surface that the weather lands on, and that the combined pair of models beats either alone.
4.1 Doing cold starts with no weather stations
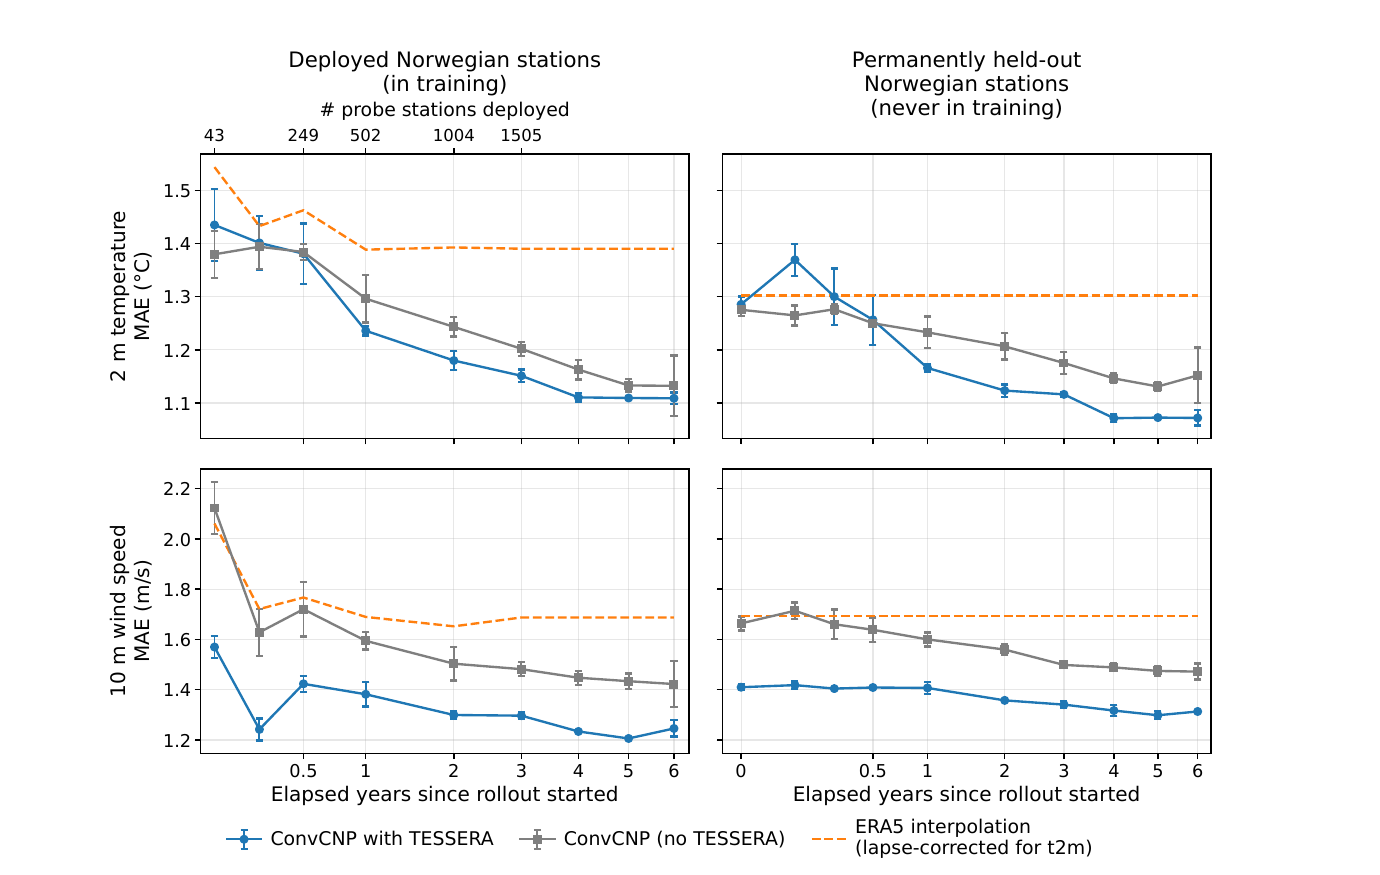
We also simulate deploying a brand-new station network in Norway, starting from zero local observations. For wind, the TESSERA model is 16.7% better than ERA5 interpolation before a single Norwegian station ever comes online. Meanwhile, the terrain-only baseline needs about a year of local weather data to pull ahead of it. After six years and 1500 deployed stations, the baseline still hasn't caught up with the accuracy the Tessera-equipped one achieved on day zero.
Given that most of the world outside of Europe and the USA does not have a dense, decades-old station network, getting good local predictions with just Tessera has important implications for the majority world.
Several caveats apply, of course. Our preprint only covers instantaneous temperature and wind, and we're planning precipitation next. The embedding is also a static 2017 snapshot, so changing land cover or urban growth are not yet represented. Time-indexed embeddings are an obvious extension as well.
Please do check out the project page and get in touch with Pedro Sousa or me if you have a downscaling problem of your own! We're working on some exciting new findings as well, so if you're interested in an MPhil project on weather in the Computer Lab, do also get in touch.
(Thanks to Pedro Sousa for reviewing earlier drafts of this post).
Read more about Earth observation embeddings are effective sub-grid descriptors for probabilistic weather downscaling.