
Thanks to a combination of satellite information, remote sensors and data-science, we now are able to reason about places all over the globe from the comfort of our desks and offices. But sometimes, you just want to be able to see or touch an area to understand it properly: the flat 2D-projection on a screen doesnt necessarily reveal the subtle geography of a landscape, and data locked into a computer feels less immediate than even a physical model of the same area.
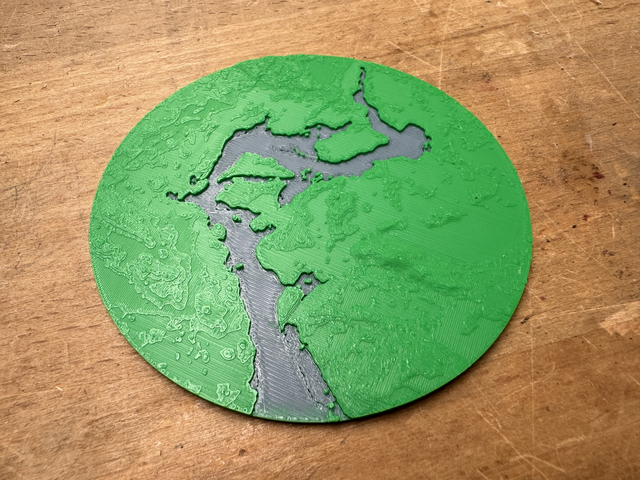
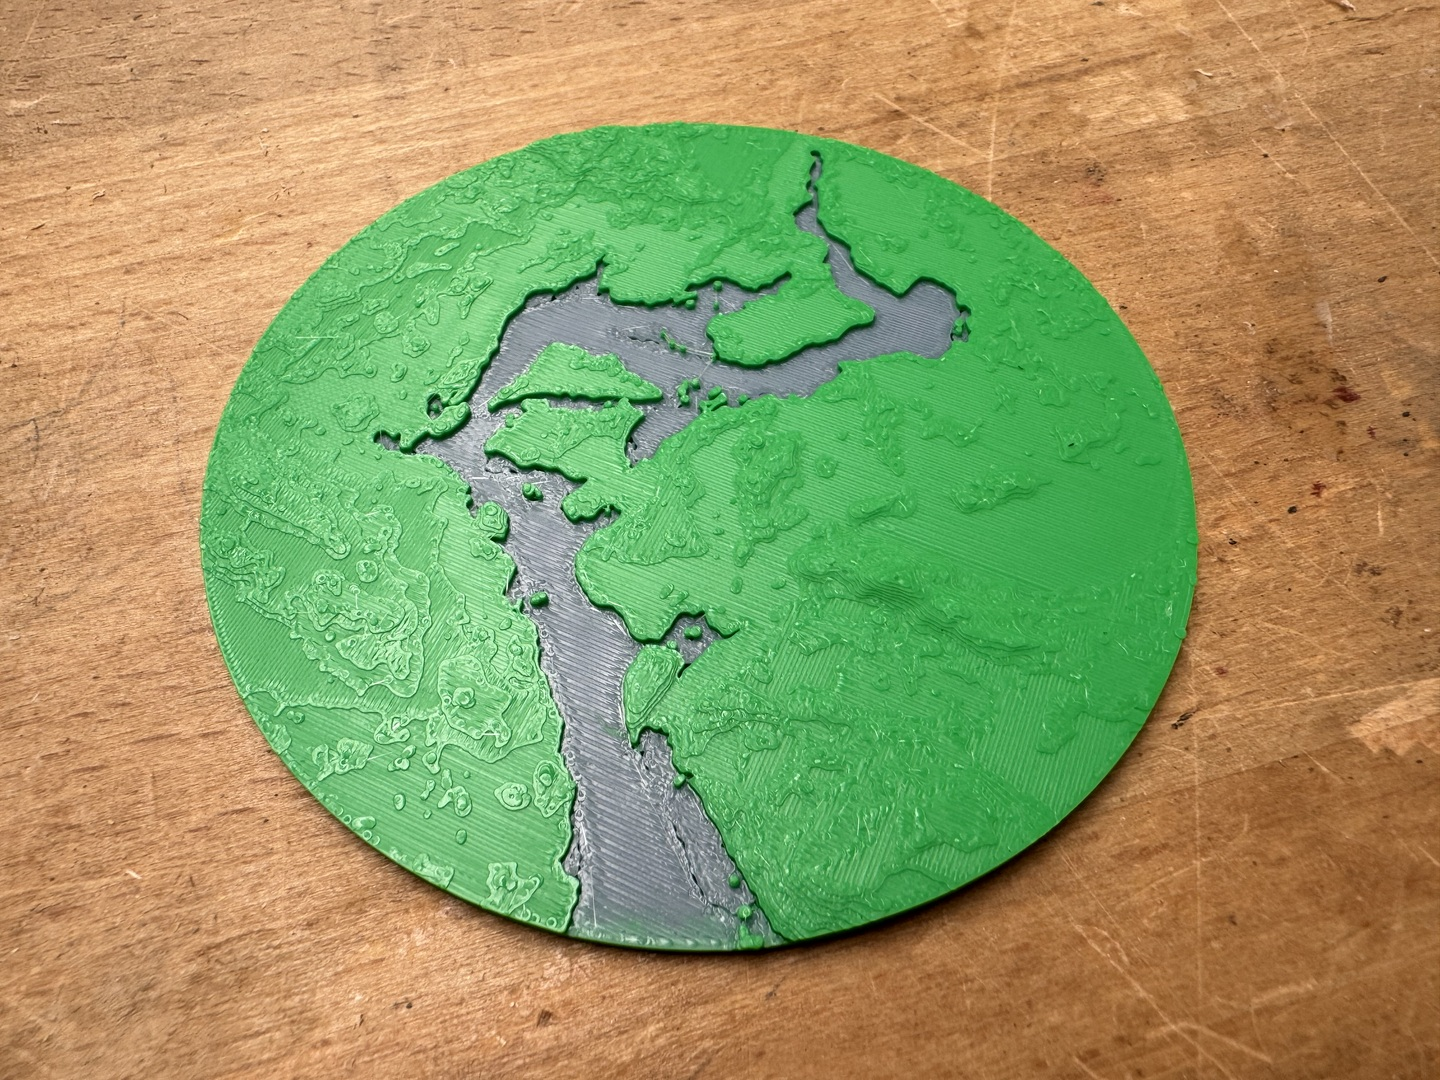
In work in early 2025, Michael Dales has experimented with making 3D-printed models of surface terrain to make some areas of study more relatable. By combining high resolution Digital Elevation Maps (DEMs), and CAD software we were able to scale and print this section of a Swedish forest used to observe Moose migrations.
However, this method is not easily scalable as:
- The data sets involved are cumbersome in size.
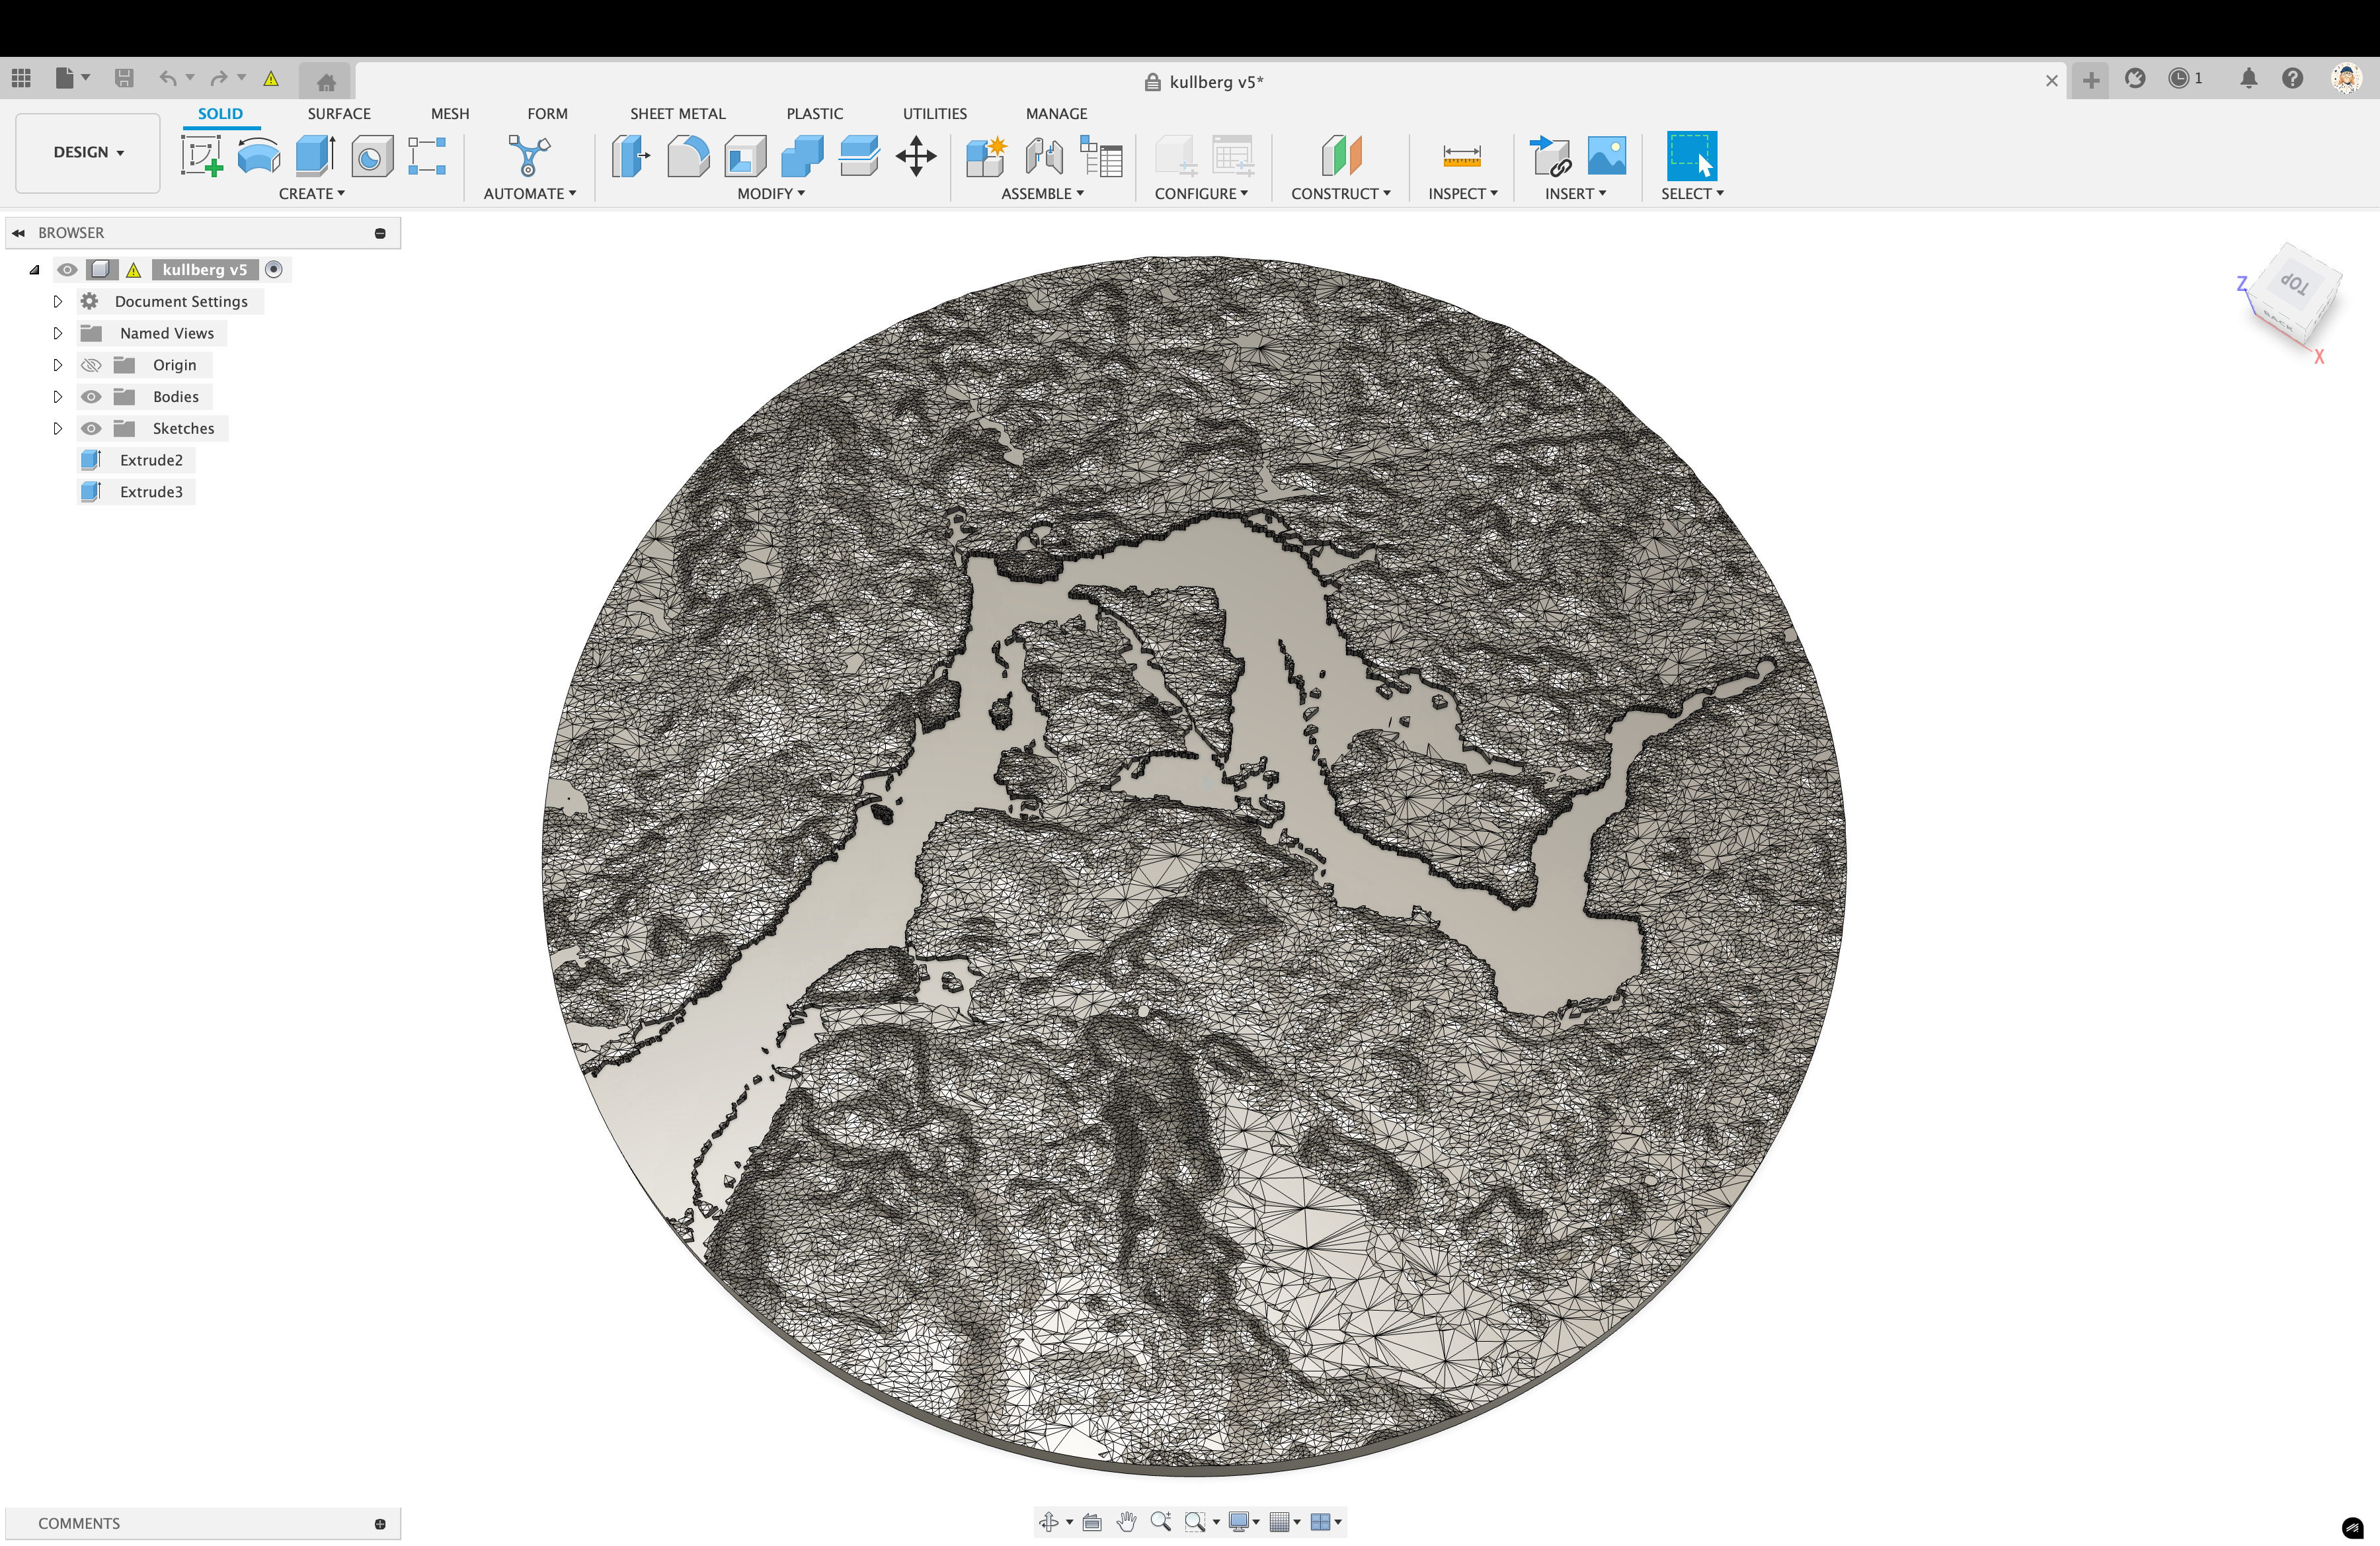
- The resulting meshes are very detailed, causing even professional grade CAD Software to struggle.
- Raw data does not normally work out of the box for visualisations as 3D-model. For example, water levels have to be added, and often the height has to be accentuated to make it look realistic to our eyes.
There are some general tools that can help with this, but they don’t support adding custom data layers in that would allow us to project data-science results onto a physical surface, and nothing that is open-source that others can readily work with.
1 The summer project
We’d like to build a simple workflow based around open source tools such as Python, GDAL, and optionally QGIS, to take geospatial results from ecologists and render them ready for 3D-printing. The goal is to make it trivial for ecologists to combine datasets and render them physically without having to become experts in 3D-modelling.
In this project we’d like to:
- Use off the shelf Python libraries to select datasets, and covert them to 3D-meshes
- Provide a way to generate multi-colour meshes for use with the Bambu Carbon printers that we have access to which support up to 8 colours of filament
- Test it using one of the active projects in the group, such as the LIFE global extinction risk maps
We'll have access to 3D printers in the Cambridge Makespace, so this is a good project for a student who wants to get into the nitty-gritty of making things!
2 Project notes
Finley Stirk built topogmesh over the summer of 2025, and kept weeknotes as he went. His tool takes an elevation raster and an area of interest and writes a ready-to-print 3mf file, using OpenStreetMap tags to colour the features. It is published on PyPI.
- Starting my UROP, 7 July. A first prototype turning a GeoTIFF into a printable mesh. Bambu Studio rejected the early meshes over non-manifold edges, which came down to triangle winding order leaving every normal pointing inwards. Colour meant dropping lib3mf and writing the 3mf container directly, since the slicer reads colour only from files it believes are its own.
- First terrain prints, 14 July. First print at the Cambridge Makespace. Moving to FABDEM took the resolution from 90m to 30m and gave global coverage, and stitching tiles lifted the size limit. Fetching the 300GB of elevation data on demand removed the manual download step, and the area of interest became an arbitrary polygon rather than a rectangle. Everest took under two minutes.
- Modelling at arbitrary scales, 21 July. Everest printed on the department printers. A country-sized mesh either crashes or runs for hours, and the vertex decimation needed to make it printable throws away the detail anyway, so a pre-coarsened dataset covers the whole planet in one pass. At the other end of the scale, Environment Agency LIDAR gives street-level models of central London.
- Incorporating OSM data, 3 August. First release on PyPI! Trees read as noise in the surface model and hid the boundary between buildings and roads, so subtracting the vegetation height map leaves a clean city. OSM tags then drive the colours, which is what puts rivers in their true shape rather than at a guessed water level.
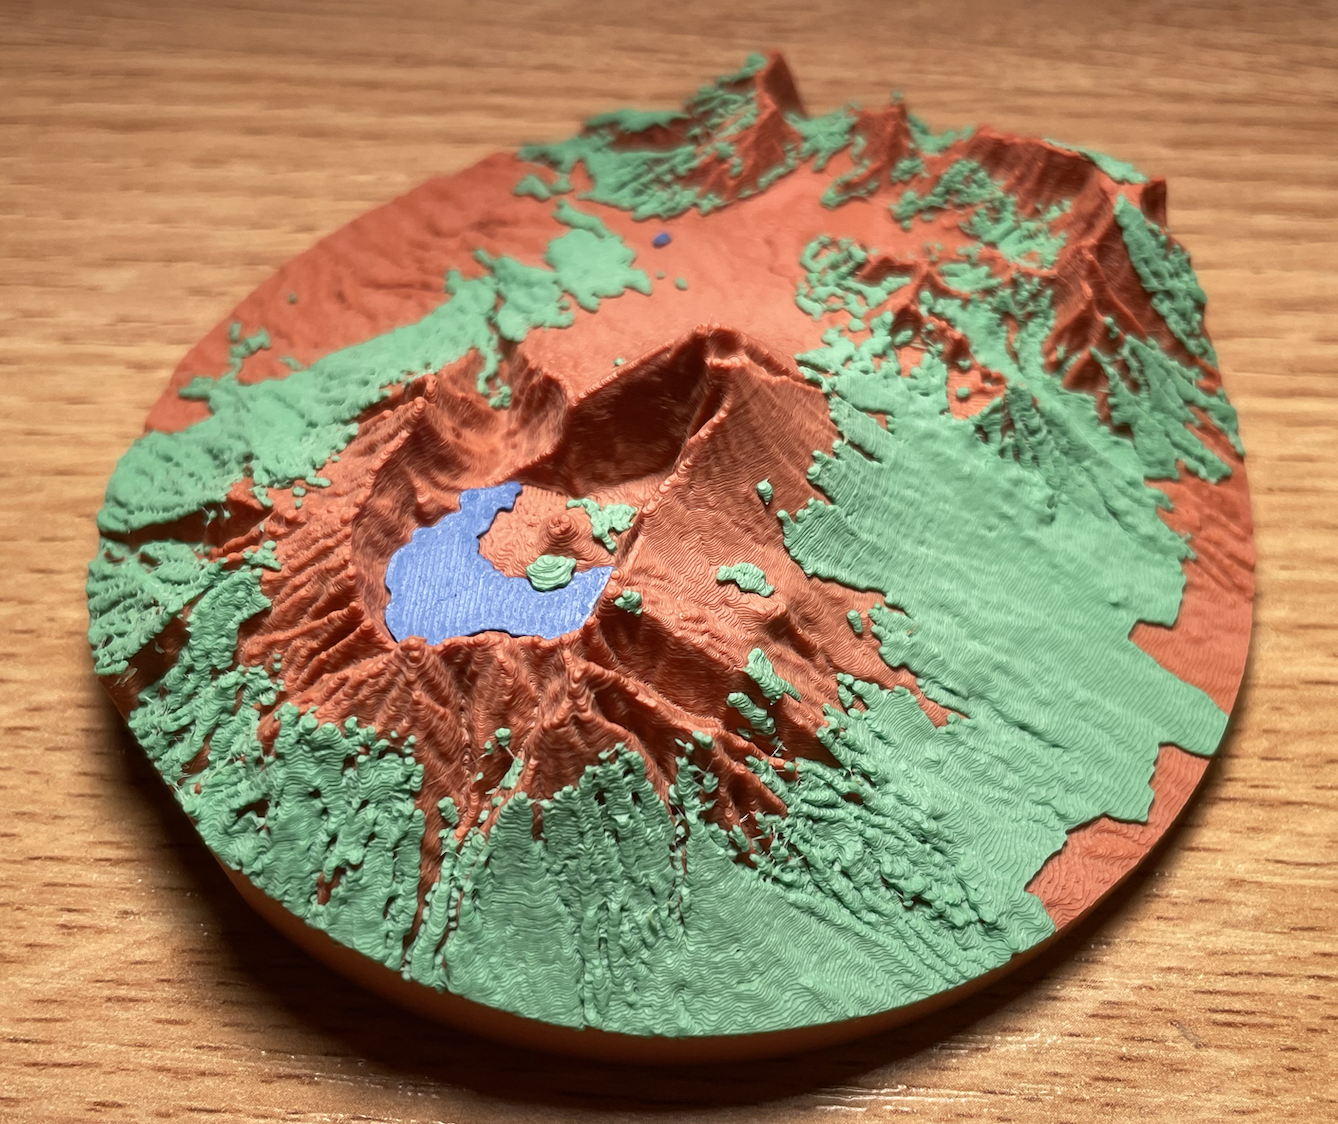
- Finishing and publishing topogmesh, 5 September. OSM colour now applies to any raster on Earth, and a new tool downloads the most recent data for a named area. The week closes on the Mount Rinjani print above and a list of what the code could be turned to next, from glacier recession to flood risk over a real terrain.
All of Finley's code is available online and linked from his website.